



On the morning of August 26, 2026, at an elevation of around 5,000 metres in Rasuwa District in northern Nepal, a piece of glacier more than 1 kilometer wide collapsed. This triggered an avalanche of rock and ice which rushed through the valley and hit the sediment deposits left by a glacier lake outburst the previous year, temporarily damming the river. When this natural dam collapsed, the wave of mud and water swept through the Bhotekoshi River and into the Trishuli River, reaching areas more than 130 kilometers downstream.
This catastrophe was not caused by a single disaster. A glacier collapsed, the debris blocked the river, and the dam burst, triggering a flash flood and sweeping away roads. A single event touched off events like a series of dominoes. Such disasters are known as “chain disasters.”
My research team, together with aiESG, Inc. and the Asian Development Bank Institute, conducted estimations as to what this disaster destroyed and how it has affected the people’s lives, based on available satellite observation data and statistical data. The study covered the three Nepali districts of Rasuwa, Nuwakot, and Dhading, which comprise 32 municipalities, and 767 villages.
We concluded that the areas of devastation, meaning areas where infrastructure and other assets were damaged or destroyed, are not necessarily the same as the places that suffered, meaning places where people required assistance and relief.
Only eight villages were directly affected, but 13,906 people were isolated by the disaster
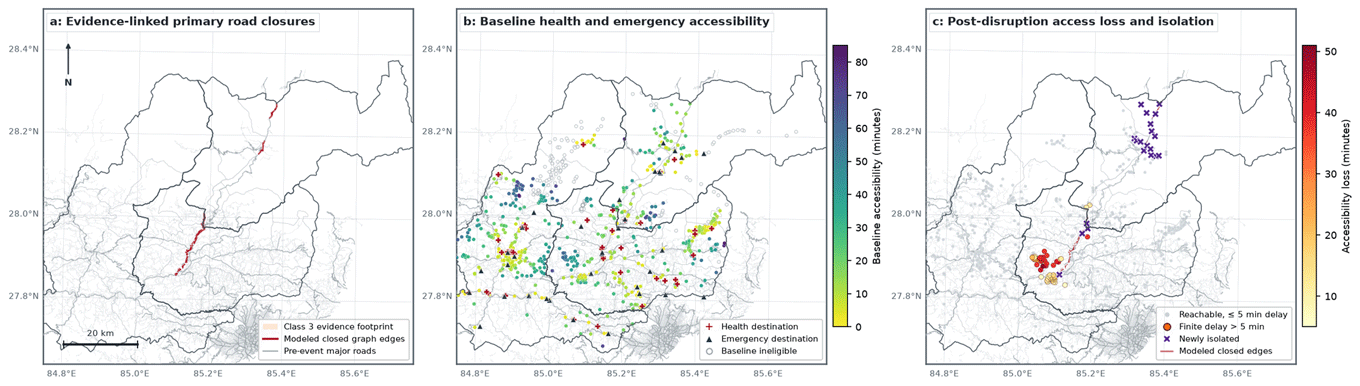
First, we identified the areas actually devastated by the disaster. The geographical areas that were confirmed as disaster-affected by multiple independent information sources, in other words the most reliable estimate of the size of the disaster area, covered 20.4 square kilometers. This area included eight villages, a total of 8,033 residents, 96.6 kilometers of roads, 2,871 buildings, 62 bridges, and 27 medical care and other emergency facilities.
The challenge begins here. According to the analysis of how road closures affected the broader road network, 13,906 residents are estimated to have become fully isolated. This exceeds the 8.033 residents located directly in the areas of devastation. In addition, 24,488 residents, while not isolated, are estimated to have experienced delays of five minutes or longer. The impact of the damage to roads calculated in terms of person-minutes comes to a total of 540,0233 person-minutes.
Many of the isolated villages are located far from the areas of devastation. There are very few alternative routes available in the northern valleys of the region under analysis. As a result, a disruption in any single section of the entire road network could cause all villages lying beyond that section to become isolated. In the south, by contrast, the road network remains intact. Travel may require detours, but connections would be preserved.
Pictures of disaster damage in a certain area can only show the physical devastation wrought there. They do not capture the isolation that is caused.
[Click to enlarge]
Restoring merely 2 of the 194 road sections is the key
Where should post-disaster recovery efforts begin?
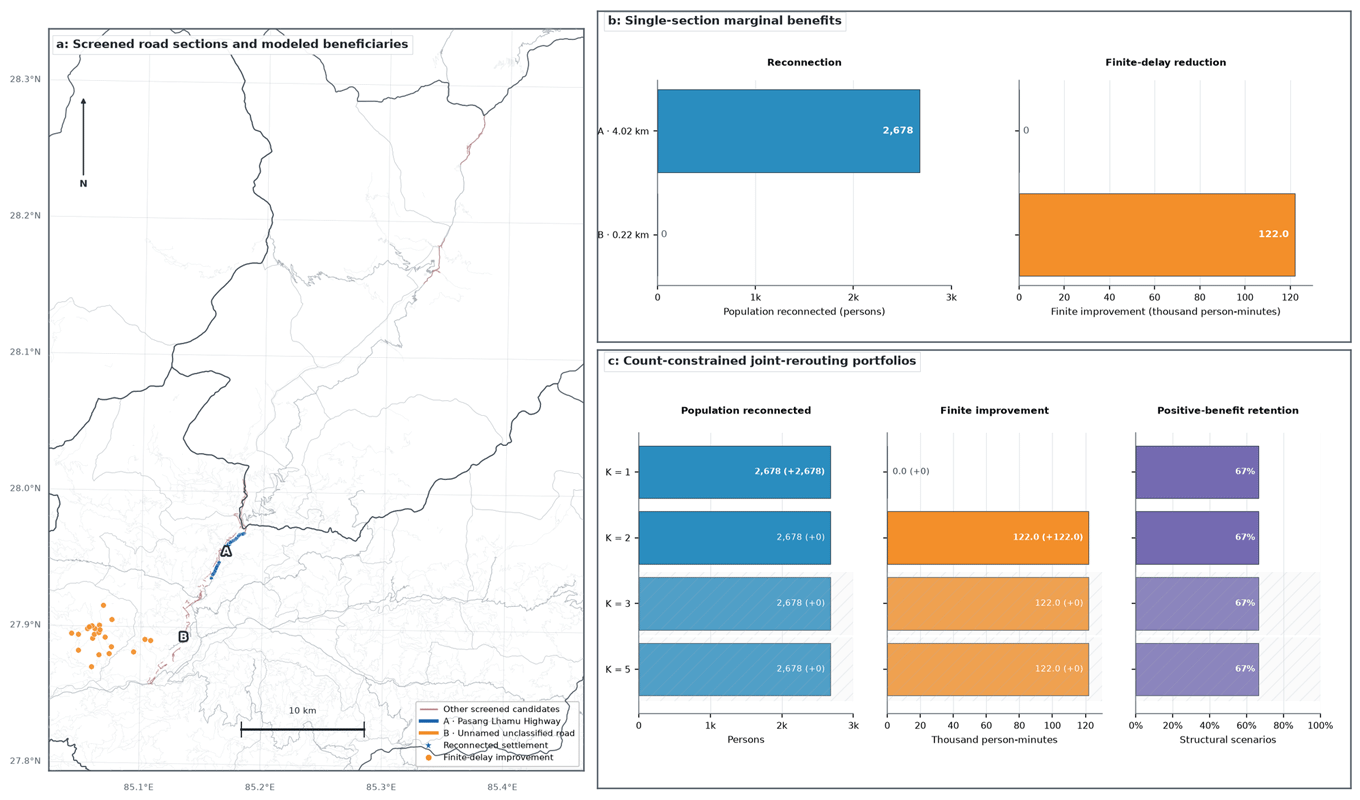
We divided the disrupted road network into 194 sections and estimated the benefits of reopening individual roads on a section-by-section basis in terms of how many people would gain access to relief assistance. We found that only two sections had significant impacts.
Moreover, those two sections served different functions. One of them is a section of the Pasang Lhamu Highway. Reopening it would reconnect 2,678 people to the outside world. However, it would not reduce travel time at all for people already connected with the highway network. The other of the two important sections was an unnamed section. Reopening this section would not lead to any elimination of isolated villages, but would remove 121,986 person-minutes of travel delay.
Restoring one road would provide reconnections with the outside world, while the other road would reduce travel time. Both fall under the “recovery” category, but their effects are different.
We then recalculated network routes under the assumption that the two road sections had already been reopened and also examined the effects of restoring additional sections, including the three most important and five most important section. We found no additional benefits under the two scenarios of reopening additional sections. The gains remained the same after the first two key roads. This suggests that the approach of sequentially based on availability of funding does not necessarily deliver proportional benefits.
Of course, this analysis merely considered how restoration work could improve road access. It does not account for whether restoration is technically feasible in the first place, how long it would take to complete, how much it would cost, or if it were possible to ensure the safety of workers. Those factors are outside the scope of this estimation. What the analysis does reveal, however, is which two road sections should be prioritized for a technical survey or engineering assessment.
[Click to enlarge]
Scenario quantity is not an indicator of the depth of analysis
We ran our model for 192 scenarios with different assumptions. The assumptions included the geographical extent of disaster-affected areas, the operational status of facilities, and how villages were connected to the road network.
In practice, however, the analysis produced only 10 distinct results from all those scenarios. The remaining 182 results duplicated one of the 10 results.
A closer examination revealed that only some assumptions actually affected the results, , such as the geographical extent of disaster-affected areas, the operational status of facilities, and how villages were connected with the road network all changes the results. On the other hand, changing the rules concerning road closure, which resulted in opening or closing up to 147 road sections, saw no change to resident access. The reason was simple: none of the reopened roads were used as access roads.
This may seem to be mundane points, but they are important. When some researchers claim to have studied many scenarios, they could, in fact, be making a hollow claim although it appears to imply analytical rigor. Unless the assumptions that materially affect results are separated from those that do not, the depth of the analysis may be artificially overrepresented.
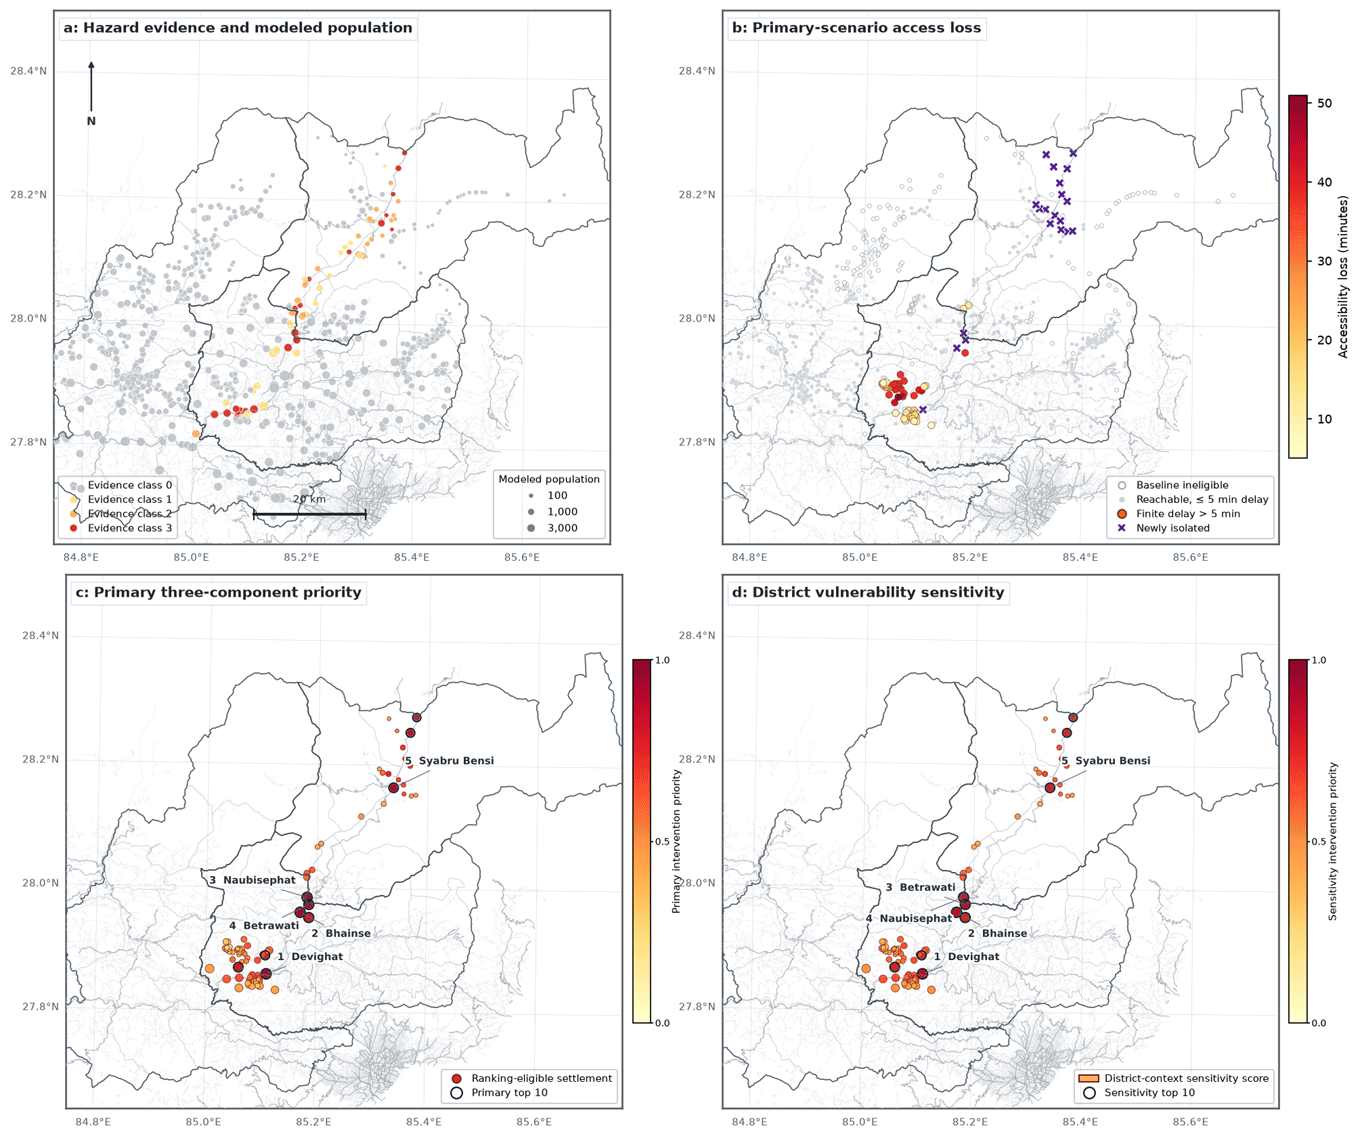
The same principle applies for prioritization. Regarding the top four priority villages, Devighat, Bhainse, Naubise Phat, and Betrawati, the order of priority remained the same under every set of assumptions used. Making changes to the weighting schemes or population allocations did not change their order of priority. By contrast, villages ranked seventh or lower repeatedly changed rankings. The seventh through ninth ranked villages continued to exchange positions, while the 10th ranked village only remained in the top ten only one-third of the time depending on assumptions.
For that reason, when personnel are to be deployed in the field, they should first be sent to the locations whose priority remains constantly in the top positions regardless of assumptions. For lower-ranked areas, it may be better to question assumptions themselves before sending personnel to conduct onsite surveys.
[Click to enlarge]
We applied the same assumptions to social indicators. In the region under study, the estimated percentage of residents who did not receive advance warning of the disaster ranges from 96.1% to 98.1%, while the estimated percentage of residents who had never participated in disaster risk management activities ranges from 75.3% to 86.0%. Those figures are alarming. However, the data are only available for broad geographic areas, such as on a district-by-district basis or by an ecozone-by-ecozone basis. In particular, for Rasua District, there was only one survey location, making it impossible even to calculate the margin of error. Therefore, instead of incorporating these indicators into the prioritization framework, we presented it separately as part of a sensitivity analysis. This avoids the impression that precise and meaningful data existed, when it did not.
The allocation of disaster relief resources is often determined by the value of damage done and the number of houses and buildings destroyed. However, our analysis showed that the quantity of damage inflicted on infrastructure and other physical structures in a certain area is not necessarily the same as the extent of disruption to the people’s lives. The collapse of a single bridge could block access to a hospital even if villages lying beyond the bridge are undamaged.
What is necessary is not simply to quantify the damage done but to identify who lost access to what resources. That can be estimated before personnel are sent on surveys, using satellite observation and publicly available data.
However, these are estimates, and not observations. Whether the roads in the affected areas are actually unpassable, whether facilities are operating, and whether residents have remained in their villages can only be confirmed through onsite surveys. The purpose of our analysis is not to answer such questions but to determine where time and human resources should be directed first to verify the onsite situation.
Disasters will occur again. The key question is not how much damage has occurred, but who lost access to which facilities and services.
September 1, 2026
>> Original text in Japanese
