The change of administration at the end of 2012 has increased the stability of political management remarkably in Japan. The political situation, in other words, has taken a turn for the better, from indecisive to decisive politics. The nationwide newspapers at the time hailed the restoration of political stability, saying that the establishment of a stable political foundation would enable the government and ruling parties to take action on pending policies.
In a questionnaire-based survey by the Research Institute of Economy, Trade and Industry (RIETI) given to about 3,400 businesses between the end of 2011 and February 2012, 33% of businesses chose government and policy stability as an element with a major impact on their management (Note 1). This result indicates that political instability affects how businesses establish plans for production and capital investment, and thus could have implications for the real economy.
In light of this, many readers may have questioned what impact that last year's restoration of political stability is having on the real economy. Unfortunately, however, there appears to be no reports that quantitatively evaluate this point, so it may not be so easy for readers to find an answer to this question.
This column's motive is to provide some material to help readers interested in the matter. Using an experimental new index on political management instability, a simple data analysis was performed. The research results derived from this analysis are tentative but very interesting.
How is political instability measured?
One problem that hovers over any quantitative evaluation of political instability's impact on the real economy is how to measure political instability. In existing experimental studies, variables like the number of important government officials assassinated or the frequency of change of administration have been used as indexes of political instability. In Japan these days, however, there are no such cases, or extremely few, so these variables may not be suitable as indexes of political instability.
The number of seats that parties have in the legislature also has been suggested as a possible proxy variable. When the ruling parties have far more seats in the legislature than do the opposition parties, it seems that political management could be considered stable. However, even when the ruling parties have a considerable number of seats, situations can occur that make political management challenging. The events of 2012 are a good example of this. In such cases, it is natural to see government stability as low. Therefore the number of seats in the legislature is not an appropriate index of political instability.
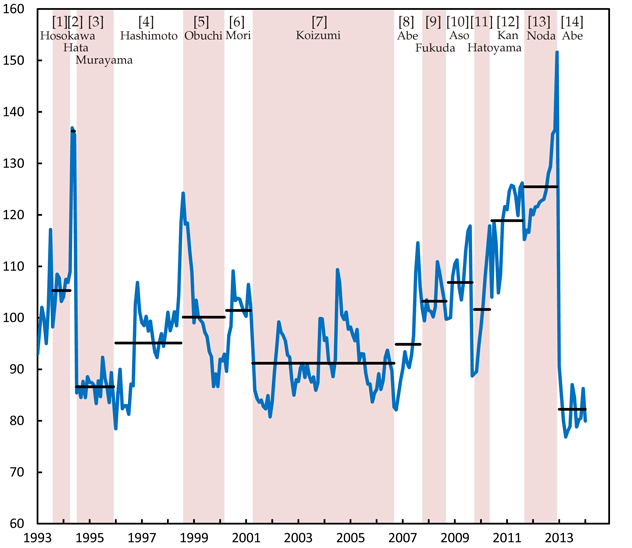
There is another potent variable that makes up for the above-described weaknesses and could be used potentially as an indicator of political instability. That is the political party approval ratings that are reported in the opinion polls that newspaper publishers, television stations, and wire services conduct monthly. Figure 1 shows the political management instability index (below, iPM index) for the period January 1993 - January 2014.

This index is derived as a weighted sum (with constant weight) of 10 series obtained after processing political party approval ratings published by Jiji Press, NHK, NNN, ANN, JNN, FNN, The Asahi Shimbun Company, Nikkei Inc., The Mainichi Newspapers, and Yomiuri Shimbun. The more evenly matched that the approval ratings of the ruling and opposition parties are, the higher is the index value. When the ruling and opposition parties are evenly matched, it is difficult for the government and ruling parties to practice smooth political management because it is under harsh attack from the opposition parties. A rise in the index can be interpreted to mean that the government and ruling parties have come to a political management impasse, namely, political instability is increasing.
A look at the figure shows that the iPM index has risen and fallen repeatedly over the past 20 years. In January 2014, the index was 80, which is low historically. Looking at successive Cabinets, the current one has produced the highest level of political stability since the Hosokawa Cabinet.
A closer look shows that the index has shifted sharply (by at least 30 points) from the previous month on three occasions: July 1994, September 2009, and January 2013. Each case was immediately preceded by a very difficult political management struggle for the government and ruling parties, wherein the political situation was very unstable. Then there was a change of administration, and political stability returned to normal.
The index also shows a general rising trend since 2007, so political instability has persistently increased. There was an election for the House of Councillors (upper house of the Diet) in July of that year, in which the Liberal Democratic Party suffered a crushing defeat. The ruling coalition parties lost more than half of the seats of the House of Councillors, and, as a result, there was a "twisted" Diet, with the houses ruled by different parties. Observers at the time feared that the twist would lead unavoidably to political instability, and the index provides evidence to confirm this.
The relationship between political instability and the real economy
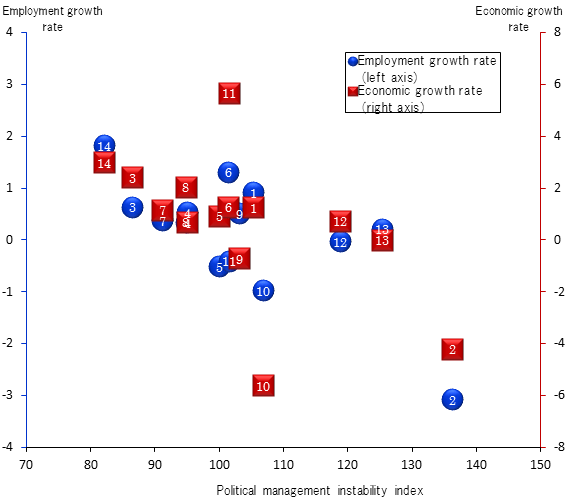
The previous section showed that the iPM index, in its way, is an indicator of political instability. The point of interest here is whether there is a relationship between this index and real economic variables. Figure 2 is a scatter plot of the iPM index and real economic variables, using data broken down by individual Cabinets. The employment growth rate and economic growth rate are used as real economic variables.

The figure suggests that when the iPM index is low, that is, when political stability is high, the employment growth rate and economic growth rate are also high. There is a negative correlation between political instability and the performance of the real economy. This fact appears to support the results of the previously mentioned questionnaire survey, namely, that political instability affects how businesses make decisions about their actions, and thus could have implications for the real economy.
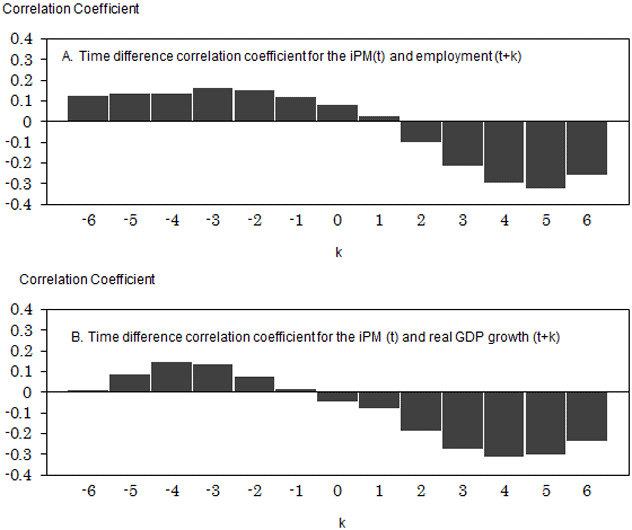
It is possible, however, that this negative correlation shows that when the real economy is not doing well (i.e., employment growth is sluggish and the economic growth rate is small), it foments disapproval of the government and ruling parties, and the iPM index rises as a result. One method applied to verify this possibility is to use quarterly data, which has a shorter time interval. Figure 3 shows the time difference correlation coefficient for the iPM index and real economic variables. Moreover, the real economic variables use detrended employment and real GDP data.

Panel A shows the time difference correlation coefficient for the iPM index and employment. The iPM index at a given point in time has a high correlation to employment from four or five quarters earlier. If one assumes that political instability stems from sluggish employment growth, then the iPM index at a given point in time should have a negative correlation to employment at an earlier time. However, the figure does not confirm this. The same is true of real GDP (Panel B).
Quantitative evaluation of the impact that political instability has on the real economy
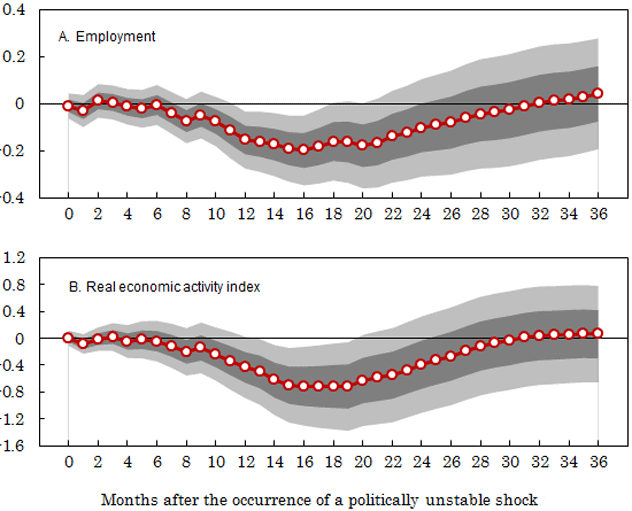
The previous section confirmed that real economic variables at a given time depend on the iPM index at an earlier time. So how do shocks, that is, unpredicted changes in political instability, affect the real economy? To investigate this, a multivariate autoregression (VAR) model made up of four variables (the iPM index, real economic variables, short-term interest rates, and share prices) was estimated. Based on the results derived therefrom, Fig. 4 shows an impulse response function of real economic variables when a political instability shock (big enough for the iPM index to rise 10 points) has occurred. Employment and a real economic activity index were used as real economic variables (Note 2).

Looking at Panel A, employment gradually deviates from the trend and declines as a result of a shock; 16 months after a shock, it reaches a peak of 0.2% and then returns to the trend. The negative effect is statistically significant between one year to 1.5 years after the shock. Looking at Panel B, shocks have a significant negative impact on the real economic activity index 13-19 months after they happen, with the impact peaking (at 0.7%) after 17 months.
According to the results, calculations of which were based on political instability shocks identified by the model, the restoration of political stability that accompanied the change of administration at the end of 2012 had an impact as demonstrated in a 0.9% increase in employment in the first half of this fiscal year and a 3.1% increase in the real economic activity index in the second and third quarters of this fiscal year. The increase in the consumption tax rate to be implemented in April 2014 may have a negative impact on the real economy. However, the positive impact produced by the restoration of political stability is likely to soften the downturn in the real economy to a degree.

