



PDF version [PDF:347KB]
Abstract
If the European Union joined the Comprehensive and Progressive Agreement for Trans-Pacific Partnership (CPTPP), the real GDP of the 12 CPTPP economies would increase, though that magnitude would be smaller than that under the United States and China joining. Agriculture, forestry and fisheries production would increase in Australia but decrease in Japan. Textiles and apparel production would increase in CPTPP economies, but motor vehicles and parts production would decrease.
On the other hand, the magnitude of a real GDP increase would widely vary among EU member states and the income gaps among EU economies would expand. EU production would increase in agriculture, forestry and fisheries as well as in motor vehicles and parts, but increases and decreases would be mixed in textiles and apparel production among its member states.
The effects on CPTPP and EU exports to and imports from the US and China would be asymmetric and affect global supply chains.
Developments of the CPTPP
Regional trade agreements (RTAs) have contributed to trade and investment liberalization and facilitation under the multilateral free trade system of the World Trade Organization (WTO), which amounted to 381 agreements in 2025. That said, those agreements have largely been concluded intra-continents but not necessarily inter-continents.
The Trans-Pacific Partnership (TPP) Agreement was signed in 2016, including American (US, Canada, Mexico, Chile and Peru), Asian (Japan, Brunei, Malaysia, Singapore and Vietnam) and Oceanian (Australia and New Zealand) economies. The US withdrew from the TPP in 2017 under the first administration of President Donald Trump, but the CPTPP entered into force among the remaining 11 economies in 2018. The United Kingdom joined the CPTPP in December 2024 following its withdrawal from the EU.
China, Chinese Taipei, Cambodia, Indonesia, the Philippines, Ecuador, Ukraine and the United Arab Emirates (UAE) have all formally applied to join the CPTPP. Accession procedures to the CPTPP commenced for Costa Rica in November 2024 and for Uruguay in November 2025 (Note 1).
Meanwhile, CPTPP parties held ministerial conferences on trade and investment dialogue with the Association of Southeast Asian Nations (ASEAN) and the EU in November 2025. Progress in further trade liberalization would be expected to be led by third economies, after protectionist movements have appeared in the two largest economies – the US and China.
Macroeconomic Impact
The real GDP impact of the EU and ASEAN joining the CPTPP is estimated in Kawasaki (Note 2), Kenichi, “Economic Impact of Expansion of CPTPP”, Policy Analysis Focus 25-11, GRIPS, January 2026 using a computable general equilibrium (CGE) model of global trade based on the 11 Data Base (Note 3) provided by the Global Trade Analysis Project (GTAP) as is shown in Chart 1. The dynamic impact of capital accumulation, endogenous labor supply and productivity improvement are incorporated into a standard static CGE model following the methodology employed by the Japanese Cabinet Secretariat.
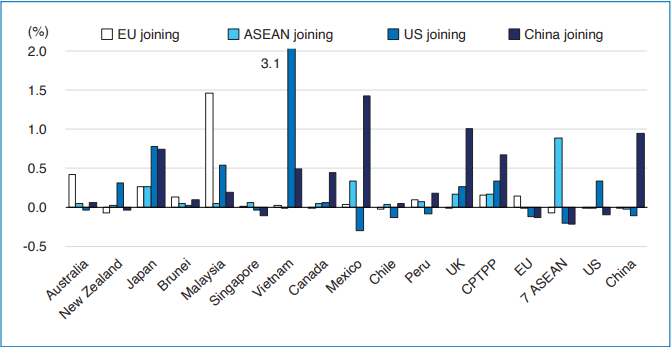
Macroeconomic benefits will be generated by tariff reductions and trade liberalization making resource allocation more efficient in production markets at home and boosting exports and production of trade partners. The real GDP of the 12 CPTPP economies is estimated to increase by 0.16% if the EU joined the CPTPP, which is coincidentally equivalent to the magnitude of a real GDP increase from the remaining seven ASEAN economies (Note 4) joining the CPTPP. That said, those real GDP gains would be much smaller than under the US joining, at 0.33%, and China joining, at 0.67%.
This would largely reflect a smaller share of the EU in CPTPP trade markets. CPTPP economies including the UK export to the US (around 34% of total exports to the world) and to China (around 13%) more than to the EU (around 11%) according to United Nations (UN) Comtrade Database. (Note 5) Meanwhile, CPTPP economies import from the US (around 19% of total imports from the world) and China (around 19%) again more than from the EU (around 15%).
The relative significance of the EU joining the CPTPP would vary among CPTPP economies. Australia (0.42%), Brunei (0.13%) and Malaysia (1.45%) are indicated to gain more from the EU joining than the US and China joining. This would be attributed to the fact that the EU has already implemented bilateral free trade agreements (FTAs) and economic partnership agreements (EPAs) with Canada, Chile, Japan, Mexico, New Zealand, Singapore, the UK and Vietnam (Note 6), according to RTAs Database by the WTO.
It may be noted here that the Japan-EU EPA alongside the CPTPP has been included in the above WTO database but the US-Japan Trade Agreement (USJTA) and the Regional Comprehensive Economic Partnership (RCEP) Agreement, whose members are Australia, New Zealand, China, Japan, South Korea and ASEAN without India, have not yet been included as trade agreements that have concluded tariff elimination on “substantially all the trade” among the parties satisfying the condition for a free trade area stated in the Article XXIV of the General Agreement on Tariffs and Trade (GATT). Much remains to be done in terms of tariff reductions among the US, China and Japan.
Impact by Industry
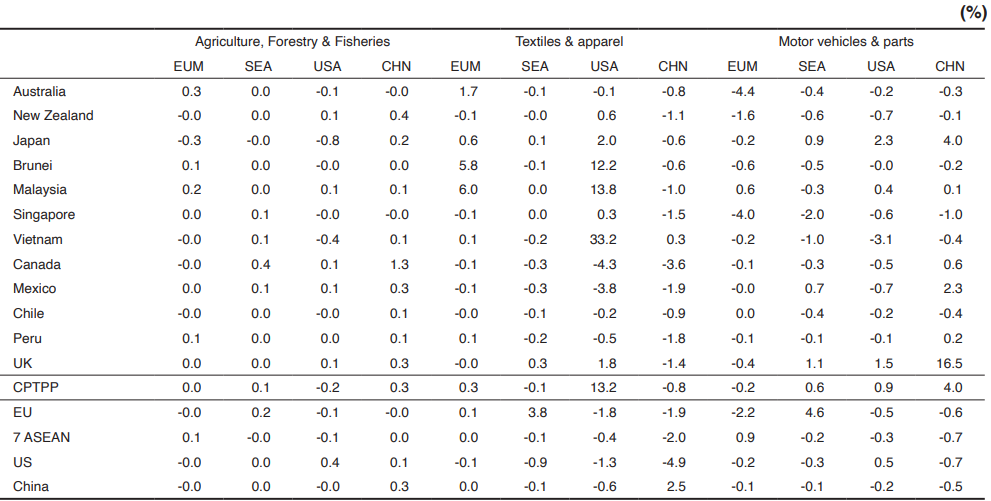
Winners and losers would be generated by industry resulting from trade liberalization according to the comparative advantage of each economy. That impact would be much larger at the sector levels than the macro level. Production would increase in agriculture, forestry and fisheries in those economies where land is physically large, in textiles and apparel in labor intensive developing economies, and in motor vehicles and parts in technology and capital intensive developed economies. The impact on production in the above three industries is shown in Table 1 as presented in my article “Economic Impact of Expansion of CPTPP”, Policy Analysis Focus 25-11, GRIPS, January 2026.
[Click to enlarge]
Agriculture, forestry and fisheries production would increase in Australia but decrease in Japan if the EU joined the CPTPP (EUM), though to a smaller extent than under the US joining the CPTPP (USA). That said, it would not necessarily decrease in Japan if China joined the CPTPP (CHN). Meanwhile, it would increase in Canada if ASEAN joined the CPTPP (SEA) and much more if China joined.
Textiles and apparel production would increase in CPTPP economies including Brunei and Malaysia if the EU joined the CPTPP, though to a smaller extent than under the US joining. It would not increase much in Vietnam, despite its significant increase under the US joining. Meanwhile, it would decrease in Canada and Mexico under the US and China joining but not so much if the EU joined.
Motor vehicles and parts production would generally decrease in CPTPP member economies if the EU joined. But it would largely increase in Japan if the US and China joined. It would also increase in Mexico and the UK under ASEAN joining the CPTPP and significantly in the UK under China joining.
Impact on EU Economies
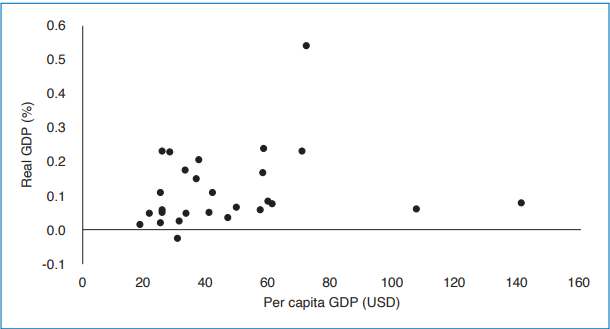
On the other hand, if the EU joined the CPTPP, the EU’s real GDP is estimated to increase by 0.14%, which accounts for possible adverse trade diversion effects resulting from the US (-0.13%) and China (-0.14%) joining the CPTPP. The magnitude of a real GDP increase would widely vary among EU members, ranging from -0.03% in Lithuania to 0.54% in Denmark, around 0.14% on average as mentioned above.
The European Commission (EC) submitted an economic impact analysis to the European Parliament when proposing trade and other policy measures including the Japan-EU EPA and other trade agreements. Those studies presented the economic impact on the EU economy as a whole but not necessarily on each EU economy, which would be of much more interest from the perspective of individual EU member states.
As a matter of fact, the estimated real GDP impact would suggest a weak correlation with income and living levels among EU economies, as is shown in Chart 2 (Note 7). This means seven to eight times income gaps ranging from $18,500 per capita in Bulgaria to $141,000 in Luxembourg (Note 8) would expand as a result of the EU joining the CPTPP. The variation of macroeconomic impact on the diverse EU states would be a matter of concern for them.
This variation at the macro level may reflect the comparative advantage of economies at the sector levels. It is estimated that EU agriculture, forestry and fisheries production would generally increase in the EU by 0.1% in total, and most of all in Denmark. Motor vehicles and parts production would increase by 0.8% in total, with the largest in Belgium followed by Germany. On the other hand, impact on textiles and apparel production appears to be mixed, increasing in 10 economies and decreasing in 17 economies, which offset each other resulting in virtually no change (0.0%) in the EU overall.
Effects on Global Supply Chains
Classical trade theory argues that comparative advantages of economies would induce vertical trade between developing and developed economies. New trade theory explains horizontal two-way trade introducing imperfect substitution of commodities among economies. This means products would be differentiated by location of products. Japan and the EU trade in autos and other products with each other to some extent regardless of relative prices.
There are income effects and two price effects caused by tariff reductions. One price effect is in positive trade creation between the economies where tariffs would be mutually reduced. The other is in negative trade diversion effects where trade with third economies by those tariff reducing economies would be replaced by newly created trade. On the other hand, tariff reduction would lower production costs and improve export competitiveness in the global market. Meanwhile, income effects would generally boost imports including those from third economies. The impact of the EU joining the CPTPP on global supply chains would be a matter of concern in light of these mixed positive and negative income and price effects.
CPTPP economies trade with the US and China more than with the EU, as mentioned. On the other hand, the EU primarily trades within its own member states. If the EU joined the CPTPP, the regional trade structure would be affected to some extent according to estimates in my article previously referenced. The CPTPP economies’ export ratio to the EU over exports to the world would increase by 0.17% and the EU export ratio to CPTPP economies would increase by 0.41%. The trade ratio within the EU would not decrease (0.01%) but it may decrease within CPTPP economies (-0.07%).
The impact on CPTPP and EU trade with the US and China appears to be mixed. The CPTPP export ratio would increase to the US (0.04%) and China (0.07%) but the import ratio would decrease from the US (-0.09%) and China (-0.08%). In contrast, the EU export ratio would decrease to the US (-0.04%) and China (-0.03%) but the import ratio would increase from the US (0.02%) and China (0.03%). Asymmetric effects on CPTPP and EU exports to and imports from the US and China would affect global supply chains. That said, the details should be studied more at the sector levels.
Expected Non-Tariff Measures Reductions
The TPP and the CPTPP have been said to be “a landmark 21st-century agreement, setting a new standard for global trade while taking up next-generation issues (Note 9).” The TPP Agreement is composed of 30 chapters covering various areas alongside market access, i.e. tariff reductions. The CPTPP Agreement has suspended several provisions including those on intellectual property rights, but such wide coverage remains unchanged.
But progress in reducing non-tariff measures (NTMs) appears to be limited in the TPP and the CPTPP. It has been pointed out that the effects of NTM reductions in goods trade would be limited and macroeconomic benefits for Canada could largely be generated by a reduction in tariffs and legally binding commitments in service trade (Ciuriak, Dan, Ali Dadkhah and Jingliang Xiao, “Better In than Out? Canada and the Trans-Pacific Partnership”, E-Brief, C. D. Howe Institute, April 21, 2016).
On the other hand, the EC estimates that Japan’s NTMs on motor vehicles and parts imports from the EU would be reduced by 6.1% in terms of ad valorem equivalents (AVEs) of tariffs resulting from the Japan-EU EPA (The Economic Impact of the EU-Japan Economic Partnership Agreement (EPA), An analysis prepared by the European Commission’s Directorate-General for Trade, European Union, June 2018). This would account for more than half of the possible magnitude of Japan’s AVEs of NTMs on imports of motor vehicles and parts (11.1%), which is much higher than the levels of Japan’s estimated corresponding average NTMs (3.3%) and average world NTMs on motor vehicles and parts (3.2%) (Note 10).
It is expected that the EU’s joining the CPTPP would deepen the modality of NTM reductions and services and investment liberalization alongside expansion of CPTPP member economies, generating further economic benefits of trade and investment liberalization and facilitation. What is essential in terms of economic impact will be specific policy measures that would affect the volumes and prices of trade in a visible magnitude, rather than the predictability and stability of a rules-based trade system in general.
Annex: Impact of Withdrawal of MFN Under the WTO
The US has introduced additional tariffs under the second Trump administration starting in January 2025, alongside those under the first Trump administration on imports of steel by 25% and aluminum by 15% based on Section 232 of the Trade Expansion Act and on imports from China based on Section 301 of the Trade Act. Reciprocal tariffs announced in Executive Orders in July 2025 based on the International Emergency Economic Power Act (IEEPA) were struck down by the US Supreme Court in February 2026. That said, steel and aluminum (50%), motor vehicles and parts (25%), copper (50%), lumber and their derivative products (25%) and semi-conductors (25%) still have additional tariffs imposed based on Section 232 of the Trade Expansion Act and others.
Additional US tariffs have been higher than bound tariffs that are legally binding under the WTO (3.4% in 2024 according to WTO Stats) (Note 11) and those have varied among US trade partners that have not been allowed by most favoured nation (MFN) treatment of the GATT Article I. In the meantime, motor vehicles and parts tariffs have been reduced to 10% on US imports from the UK (10%) as well as to 15% from Japan, South Korea and the EU, lower than the uniform 25% tariffs for other economies once resulting from tax negotiations with the US but still subject to changes.
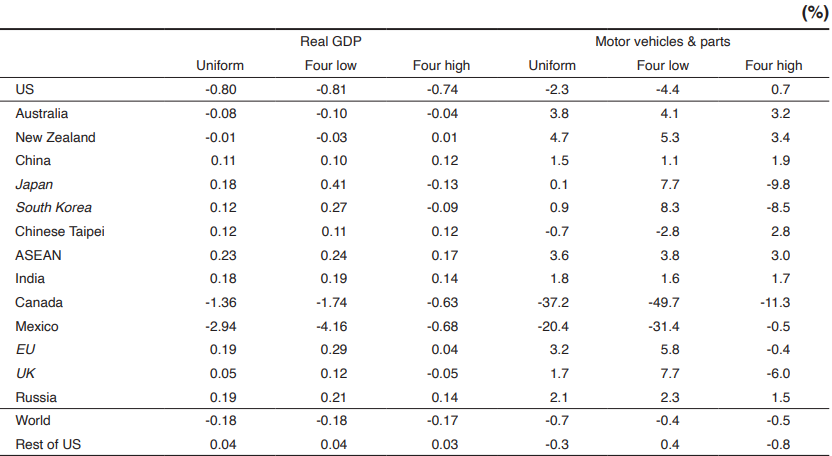
The costs of the US withdrawing MFN treatment under the WTO are studied in Kawasaki, Kenichi, “Costs of Withdrawal of MFN under WTO”, Policy Analysis Focus 25-14, GRIPS, January 2026. The relative significance of those costs was compared among three scenarios of additional US tariffs on imports of motor vehicles and parts: 1) a 25% tariff across economies in the world (uniform), 2) a 15% tariff on Japan, South Korea, the EU and the UK and a higher than 25% (31%) tariff on the rest of the world (four low), and 3) a higher than 25% (43%) tariff on the above four economies and a 15% tariff on the rest of the world (four high). It is assumed that average tariff rates among the three scenarios remain unchanged at 25%.
If the US imposed an additional 25% tariff on imports of motor vehicles and parts and trade partners reciprocally retaliated, the US would primarily be a loser rather than a winner as is shown in Annex Table. US real GDP is estimated to decrease by around 0.7% to 0.8% in all three scenarios. What is essential for the macroeconomic impact would be the levels of higher than bound tariff rates regardless of those varieties among the source of imports. But the adverse impact on US motor vehicles and parts production would be worse if additional tariffs were lower for the above four economies that are competitive in motor vehicles and parts production, and it would be better if additional tariffs were higher for the four economies.
[Click to enlarge]
On the other hand, the impact on other economies would vary among the three scenarios. Japan, South Korea, the EU and the UK would benefit from trade diversion effects if their imposed tariffs were lower than others but lose if their imposed tariffs were higher than others. Canada and Mexico would generally lose much more than the US across the three scenarios, but those adverse magnitudes would be correlated to their relative position in terms of imposed tariff rates among economies. In contrast, other economies including China, ASEAN, India and Russia would not necessarily be adversely affected across three scenarios studied.
The benefits of free trade should be supported by a rules-based trade system. Tariff hikes would generate an adverse economic impact primarily on the imposing nation’s economy, and possibly differing among trade partners. MFN treatment should be maintained without allowing protectionism.
This article first appeared on the July/August 2026 issue of Japan SPOTLIGHT published by Japan Economic Foundation. Reproduced with permission.
July/August 2026 Japan SPOTLIGHT
