

Japanese government debt is forecasted to reach 1,344 trillion yen by the end of fiscal year 2026 (FY2026). Servicing the debt is forecasted to cost more than 31 trillion yen in FY 2026 (Ministry of Finance, 2026). This comprises 26% of government expenditures.
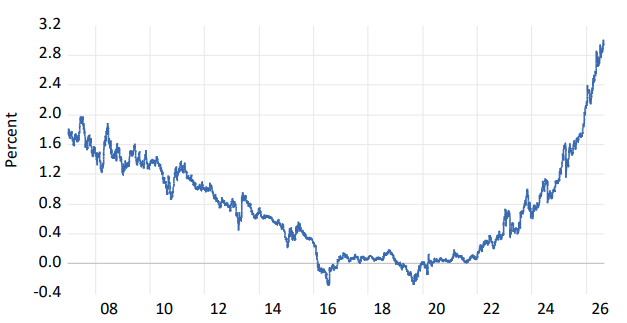
Interest rates on Japanese government bonds (JGBs) are thus important. The Bank of Japan (BoJ) kept 10-year JGB rates close to zero starting in 2016. Then, in an attempt to normalize interest rates, they allowed 10-year rates to increase beginning in 2021. As Figure 1 shows, by August 2026, 10-year JGB rates reached 3%.
In a normal environment, assets’ interest rates and expected returns depend on their risk characteristics. Investors demand higher returns for holding riskier assets. Stocks are risky and must therefore offer higher returns. As Campbell et al. (2026) noted, when bond returns comove positively with stock returns, bonds become riskier (Note 1), and must therefore offer higher interest rates.
Pflueger (2025) found that bond and stock returns covary positively when inflation covaries negatively with the business cycle and when monetary policy is aggressively anti-inflationary. Negative supply shocks such as oil price increases cause inflation to covary negatively with economic activity. This is because oil price increases raise consumer price inflation and slow economic activity. Since bonds yield a fixed nominal return, inflation reduces bond returns. Thus, inflationary supply shocks reduce bond returns at the same time as they slow economic activity. If monetary policy aggressively fights inflation, then supply shocks that increase inflation also elicit contractionary monetary policy, which in turn reduces stock returns. This combination of adverse supply shocks and contractionary monetary policy thus causes bond and stock returns to comove positively.
This combination was seen in the 1960s and 1970s. At this time bond and stock covariances in the U.S. turned from negative to positive (see Thorbecke, 2026). However, as Campbell et al. (2026) showed, after 2000 bonds and stocks in the Eurozone, the U.S., and the U.K. comoved negatively. Pflueger (2025) attributed this to the less hawkish monetary policy implemented after 2000.
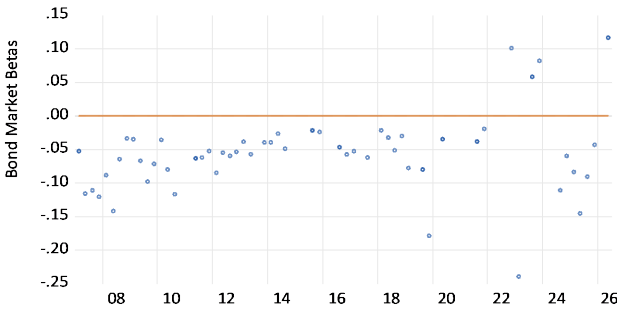
How do returns on JGBs and Japanese stocks comove? To investigate this question, one can regress returns on 10-year JGBs on returns of the Japanese aggregate stock market. Figure 2 shows the results from doing this for every quarter between the first quarter of 2007 and the second quarter of 2026. The figure shows the regression coefficients that are statistically significant at least the 10% level.
Japanese bond and stock returns covaried negatively from 2007 to 2021. Then in the fourth quarter of 2022 and again in the third and fourth quarters of 2023 Japanese bond-stock covariances turned positive. At this time the Russia-Ukraine War raised food and energy prices and stoked inflation. The BoJ, while keeping the overnight call rate below zero, did allow 10-year JGB rates to increase. Figure 2 shows that Japanese bond-stock comovements again turned positive in the second quarter of 2026. At this time the U.S.-Iran War stoked inflation and the BoJ fought inflation.
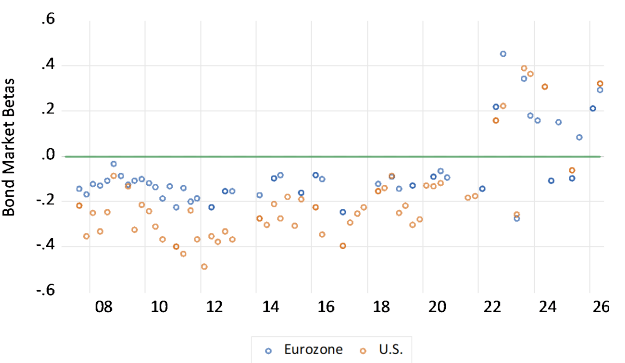
Figure 3 plots bond-stock comovements for the Eurozone and the U.S. The results are similar to those for Japan. Bond-stock comovements were negative until 2021. They then turned positive in 2022 and 2023 and again in the second quarter of 2026. After 2022 there were more cases of positive bond-stock covariances in the Eurozone and the U.S. than in Japan. This reflects the fact that the inflation rates in the Eurozone and the U.S. reached twice the levels experienced in Japan. In addition, the Federal Reserve and the European Central Bank fought inflation more aggressively than the BoJ did.
Nevertheless, the similar bond-stock comovements in Japan, the Eurozone, and the U.S. indicate that global factors played a crucial role in increasing the riskiness of bonds across developed economies. Prime among these are the consumer price increases sparked by the Russia-Ukraine War and the U.S.-Iran War.
Japan will not be able to stop global supply shocks that raise oil prices and fuel inflation. It should instead encourage businesses to reduce their exposure to fossil fuels and to choose environmentally friendly production methods. It should also invest in technologies to improve wind, solar, and hydro power. This will reduce the inflationary impact of adverse supply shocks and help protect the Japanese bond market.