


Deflation is a threat to the macroeconomy. Japan had suffered from deflation for more than a decade, and now, Europe is facing it. To combat deflation under the zero interest bound, the Bank of Japan and the European Central Bank have resorted to quantitative easing, or increasing the money supply. This column explores its effectiveness, through the application of novel methods to distinguish signals from noises.
Recent empirical works on micro price dynamics hitherto have uncovered the little known dynamics of micro prices (see Klenow and Malin 2011). A new study of individual prices of goods and services for Japan from January 1980 to June 2013 (Yoshikawa et al. 2015) shows that the frequency of individual price changes and synchronisation are not constant but instead are time-varying (Figure 1), while the existing literature routinely assumes otherwise. Moreover, they change in clusters, not simultaneously in the economy as a whole. In this respect, there is a significant gap between observed facts and theory because, in standard theory, changes in money, supposedly the most important macro disturbance, more or less uniformly affect all prices (Klenow and Malin 2011). Examination of the autocorrelations of individual prices (Figure 2) reveals the importance of interdependence of individual prices with leads and lags. We analysed such lead/lag dynamics of individual prices to find out what are the major macroeconomic variables leading to systemic changes in aggregate prices.
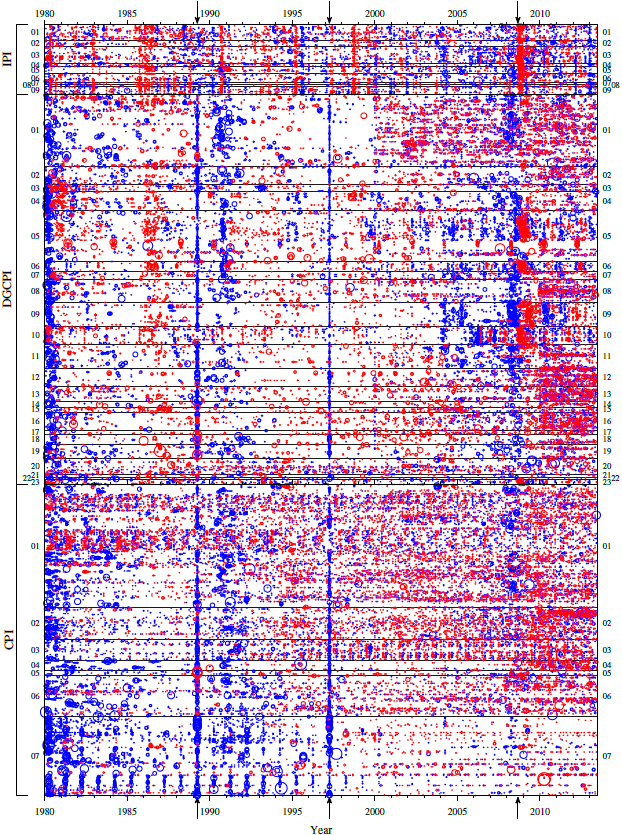
Blue and red colors correspond to changes above certain thresholds, while smaller changes are left as blank. Two months denoted by the left two arrows on the abscissa--the distance from a point to the y-axis, measured parallel to the x-axis--show the months of introduction and the raising of the consumption tax rate (April of 1989 and 1997 respectively), and the third arrow shows the subprime mortgage crisis (September 2008).
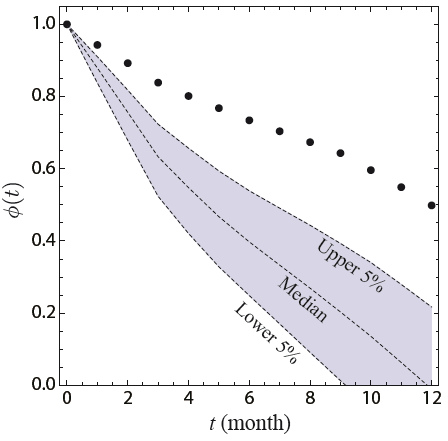
The sum of all of the autocorrelations of individual prices (dots) is compared with the colored region of the null hypothesis, obtained by randomly rotating them independently in the time direction such that any interdependency is destroyed.
Signals and 'core Consumer Price Index'
In looking at any data, economic or otherwise, it is fairly important to identify what is at their core. Take 'air'--noises or 'random' fluctuations come from thermal individual motions of molecules, while sounds are collective motions of interacting molecules. If we are to find meaningful signals in the motion of air, we need to identify the latter.
'Core Consumer Price Index' pushed forward by central banks aims for this, but only with heuristic arguments. A scientific way to identify signals, called the Complex Hilbert Principal Component Analysis and the Rotational Random Simulations were invented--the latter by us--and applied successfully to physics, meteorology, economics (Vodenska et al. 2014) and other areas. Applied to prices, we find that only 26 modes of collective motion among 830 modes are significant signals, which should constitute the new 'true core Consumer Price Index'.
Macroeconomy and the 'true core Consumer Price Index'
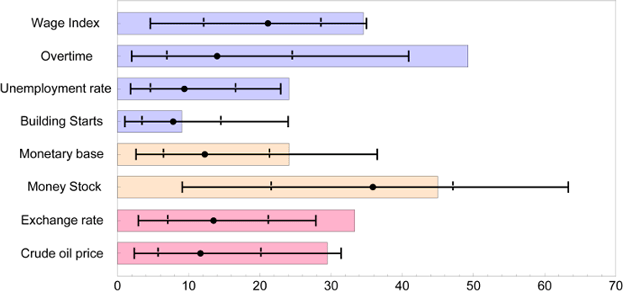
Systemic co-movements of micro prices are conditioned strongly by the state of the macroeconomy. Then, which aspects of the macroeconomy are crucial for the price changes? Figure 3 shows the relevant result for the first (most important) comovement mode, showing that only "Overtime" and "Exchange rate (yen/US$)" have a significant correlation with prices, followed by "Wage Index," "Unemployment rate," and "Crude oil price," but never with "Monetary base" or "Money Stock".
The second important factor (eigenmode) generating the systemic fluctuations of individual prices is significantly correlated with the exchange rate and crude oil price. In an open economy such as that of Japan, changes in the exchange rate and oil price affect the import prices without lags, and, in turn, modify the costs of energy and materials used in the production of a wide range of goods and services. With lags, many prices follow suit. The case study of the post-Plaza Accord period when the yen sharply appreciated from 240 per US dollar to 120 amply demonstrates the presence of this mechanism.
The results for all of the other 24 statistically significant modes are similar: changes in the aggregate price index, namely, deflation or inflation, consistent with systemic fluctuations of micro prices, are not directly linked to changes in money supply such as M2 and base money.
The reason is that, except for when it is at the irregular zero interest rate bound, monetary policy is interest rate policy ubiquitously that makes the money supply endogenous, or even passive as Black (1986, p. 539) observes.
The result is consistent with the old Phillips curve, which states that in booms, both quantities and prices change upward while the converse holds true in recessions. Note that the Phillips curve is not a mere correlation between price and quantity. It is not the case that quantities change because prices do not change. Rather, prices change responding positively to changes in quantities. Causality runs from the level of real output to changes in prices. The Phillips curve, a macro equation, emerges from aggregation of heterogeneous markets (Lipsey 1960, Tobin 1972, Okun 1981). The bottom line is that the aggregate price index rises when the average level of real economic activity as represented by overtime hours worked or the unemployment rate goes up.
Conclusion
Deflation and inflation are macroeconomic phenomena. However, we cannot fully understand them by only exploring macro data because the behavior of aggregate prices such as the Consumer Price Index depends crucially on the interactions of micro prices. On the other hand, all in all, the results we obtained have confirmed that aggregate prices significantly change, either upward or downward, as the level of real output changes. The correlation between aggregate prices and money, on the other hand, is not significant. The major factors affecting aggregate prices other than the level of real economic activity are the exchange rate and the prices of raw materials represented by the price of oil. Japan suffered from deflation for more than a decade beginning at the end of the last century. More recently, Europe faces a threat of deflation. Our analysis suggests that it is difficult to combat deflation only by expanding the money supply.
This article first appeared on www.VoxEU.org on September 5, 2015. Reproduced with permission.