To eliminate the adverse effects of egalitarianism during the age of the planned economy, China has been pushing ahead with a development strategy that gives preference to growth over equality since the reform and open-door policies under the banner of the "Get Rich First Theory" proposed by Deng Xiaoping in the late 1970s. In the more than 30 years since then, the lives of the Chinese people have generally improved, but the income gap has widened to an unacceptable level. If this remains unaddressed, it could lead to instability. Fortunately, labor's share of GDP has recently started to rise in the wake of the labor shortage associated with the depletion of surplus labor in the rural areas (the arrival of the so-called Lewisian Turning Point), and, as a result, the income gap has begun to shrink. Improvement in income distribution is expected to result in the expansion of consumption.
Three gaps starting to shrink one after another
In China, although the income gap had widened in the past, mainly between the urban areas and the rural areas, between the coastal and the inland regions, and between the high-income group and the low-income group, all three gaps have begun to shrink recently.
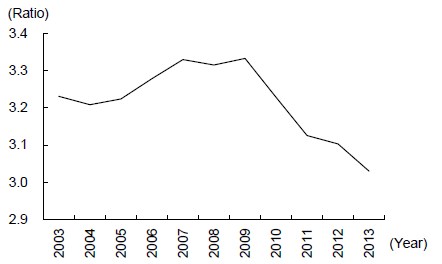
First, with respect to the gap between the urban areas and the rural areas, growth in per capita income in the latter has overtaken that in the former since 2010. Reflecting this, the ratio of per capita income in the urban areas relative to the rural areas fell from its peak of 3.33 times in 2009 to 3.03 times in 2013 (Figure 1).
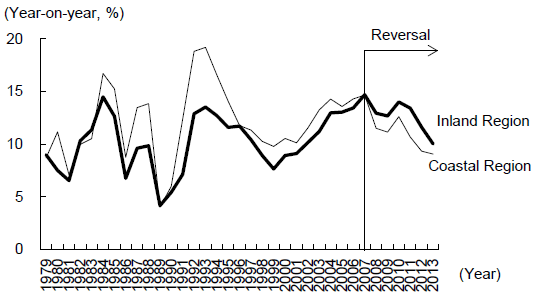
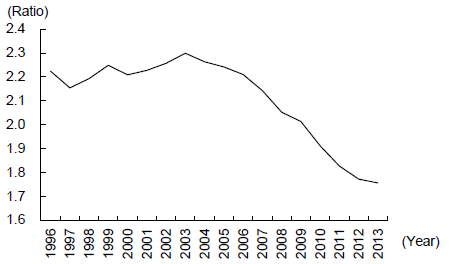
Second, regarding the gap between the coastal and the inland regions, the economic growth rate (real GDP growth rate) in the inland region has been consistently higher than that in the coastal region since 2007 (Figure 2). In addition, the ratio of per capita GDP (nominal) in the coastal region compared to that in the inland region also declined from its peak of 2.30 times in 2003 to 1.76 times in 2013 (Figure 3) (Note).
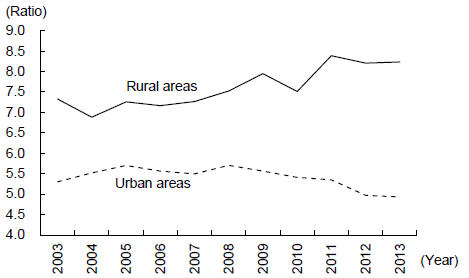
With respect to the gap between the high-income group and the low-income group, the ratio of per capita income of households in the top 20% compared to that of households in the bottom 20% fell to 4.93 times in 2013, after rising from 5.30 times in 2003 to 5.71 times in 2008 (Figure 4). In the rural areas, the ratio of per capita income of households in the top 20% relative to households in the bottom 20% has begun falling from the peak in 2011.
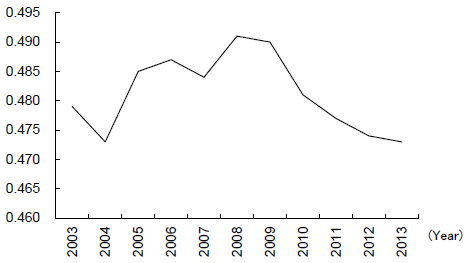
Reflecting all of these changes, the Gini coefficient, which shows the income gap of the country as a whole (with both the rural areas and the urban areas taken together), also has been declining, from its peak of 0.491 in 2008 to 0.473 in 2013 (Figure 5). However, the Gini coefficient in China is still high compared with other countries, although it has turned down.
Arrival of the Kuznets Turning Point against the backdrop of a shortage of labor
Regarding the relationship between economic development and the income gap, the theory of the inverted U-shaped curve proposed by Simon Kuznets, winner of the Nobel Prize in Economics in 1971, is well known (Kuznets, 1955). According to this theory, the income gap will widen in the early stages of economic development, but, after a period of time, it will begin to improve. Taking an indicator for the income gap (e.g., Gini coefficient) on the vertical axis and an indicator for the stage of economic development (e.g., per capita GDP) on the horizontal axis, the relationship between them will be an inverted U-shaped curve (Figure 6).
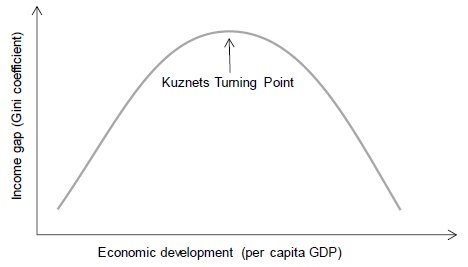
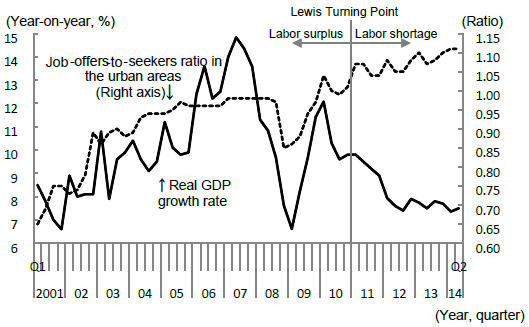
Looking at the situation in China based on this theory, the country should have just passed the peak of the inverted U-shaped curve (Kuznets Turning Point), with the income gap beginning to narrow. The trigger was the arrival of the Lewisian Turning Point, which denotes the depletion of surplus labor in the rural areas (Lewis, 1954). In the stages before the arrival of the Lewisian Turning Point when surplus labor in the rural areas exists, wages do not increase much as the economy grows so that labor's share of GDP declines while capital's share rises. Since this will work in favor of the high-income group with more capital income than the low-income group, which is dependent on wage income as its major source of income, the income gap widens along with economic development. After passing the Lewisian Turning Point, on the other hand, labor shortage emerges and wage growth accelerates. As a result, labor's share of GDP rises, and the income gap narrows.
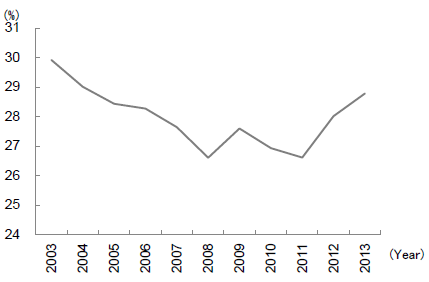
In China, as symbolized by the fact that the job offers-to-seekers ratio has continued to rise since 2011, despite a significant fall in economic growth, the Lewisian Turning Point appears to have already arrived (Figure 7). As a result, labor's share of GDP has also moved up from its bottom in 2011, and the income gap has also begun to turn down (Figure 8). Thus the relationship between the Lewisian Turning Point and the Kuznets Turning Point has been observed in China.
It should be noted that the labor shortage associated with the arrival of the Lewisian Turning Point is not the only factor for the improvement in the income distribution. The Hu Jintao government, which started in 2002, sought to reduce the income gap by promoting "the construction of a new socialist countryside," "China western development," and "the rise of Central China" under the slogan of "harmonious society," amending the "Get Rich First Theory." In addition to the government policies, large-scale labor migration from the rural areas to the urban areas and from the inland region to the coastal region has also contributed to the narrowing of the income gap through remittances home by emigrant workers.
Catalyst for the expansion of consumption
The narrowing of the income gap is expected to contribute not only to social stability but also the expansion of consumption that supports economic growth from the demand side.
In general, the propensity to consume, which indicates the percentage of income allocated to consumption, is inversely proportional to the income level and tends to be lower in the high-income group and higher in the low-income group. As the widening of the income gap indicates that income is concentrated on the high-income group with a low propensity to consume, it will become a factor to lower the overall propensity to consume. In contrast, the narrowing of the income gap means that income in the low-income group, which has a higher propensity to consume, increases more than that in the high-income group, with its low propensity to consume, and this becomes a factor to raise the overall propensity to consume.
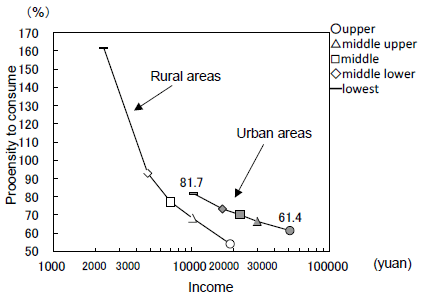
This low propensity to consume among the high-income group and high propensity to consume among the low-income group has been observed in China. First, reflecting the fact that household income in the rural areas is lower than that in the urban areas, the propensity to consume in the former was 74.6% in 2012, higher than the 67.9% in the latter. In addition, when households are divided into five groups in order of per capita income, the propensity to consume is the highest in the lowest group and declines in the order of middle lower, middle, middle upper, and upper groups in both the rural areas and the urban areas (Figure 9). For example, in the urban areas, the propensity to consume is highest at 81.7% in the lowest group and lowest at 61.4% in the upper group.
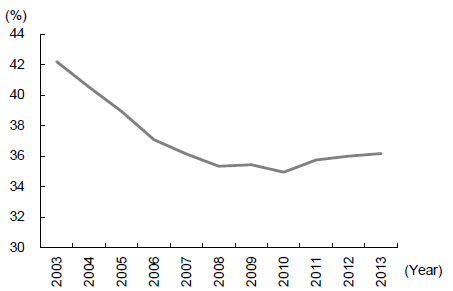
In fact, personal consumption as a share of China's GDP, which had been declining, finally began to rise from a low of 34.9% in 2010 and reached 36.2% in 2013 (Figure 10). Given that a narrowing income gap favors the expansion of consumption, it is no coincidence that this trend has begun to emerge.
As China has just passed the Kuznets Turning Point, the income gap is expected to shrink further in the future. This is likely to boost consumption significantly through a rising propensity to consume.
The original text in Japanese was posted on August 27, 2014.


