
Purpose of the Study
The fact that science is the driving force behind not only technological innovation but also economic growth is widely recognized among scientists and economists, and this is the main reason why governments support academic research. For example, Mansfield estimates 10% of new products and processes would not have been developed in the absence of recent academic research (Mansfield, 1991).
As attention focuses on science as a source of technological innovation that brings about economic growth, interest is growing in what sort of influence science has on technological innovation (Narin et al, 1997). Similarly, the importance of partnerships between industry and universities is also drawing attention (OECD, 1990).
In recent years, there have been a number of analyses that treat patents as an indicator of technological innovation by calculating the number non-patent references such as academic papers as an indicator of the degree of "science" in such patents - in other words, the number of papers cited per patent. This indicator is called "science linkage," and although there are limitations to this method, it helps to clarify the influence of science on technology. There has therefore been much research attempting to clarify the relationship between technology and science by measuring the science linkage of patents filed in the United States and Europe.
By contrast, there is virtually no research on science linkage in patents filed in Japan despite the fact that it is crucial to analyze Japanese patents in order to study the national innovation system in Japan, a country whose per-capita gross domestic product rivals that of the U.S. or Europe. Patents are applied for overseas only when they are related to tradable goods or needed for overseas production, and the benefit exceeds the cost of overseas patent application, which is double or more that of patent application in Japan. In the case of technologies related to non-tradable goods intended solely for the domestic market, and those related to goods that have no export competitiveness, patent applications are not filed overseas because there is no advantage in protecting intellectual property rights abroad; research on these technologies cannot be done by analyzing patent applications made outside Japan. In addition, the study of Japanese patents is important to conduct an international comparison with patents submitted to overseas patent offices such as the USPTO and EPO.
In this study, academic papers cited not only on the front page and but also in the main text of Japanese patents were analyzed, which have been virtually overlooked up to now. The study aims to shed light on such matters as the degree of influence science has on patentable technologies, and whether that influence differs according to technological category.
Methodology
In order to study the effects of science on technological innovation, we must somehow measure both technological innovation, which is an explained variable, and science, which is an explanatory variable. To do this, I conducted research on the relationship between patents (which are a subset of technological innovation) listed in official gazettes as having been screened under uniform standards and deemed practical and useful in light of Japan's Patent Law on the one hand, and papers such as theses published in periodicals, and materials presented at academic societies (hereafter "papers"), which can be considered the codification of scientific knowledge, on the other.
(1) Building an original database
I began by creating a database of Japanese patents using Patent Gazette CD-ROMs. From this data I analyzed gazettes (which list patent applications that the Patent Office screened and found no reason to reject) issued from 1995 to 1999. The data analyzed was restricted to this period because the International Patent Classification (IPC) used to classify the technological categories of the patent gazettes is revised every five years, and the patents issued between 1995 and 1999 are all based on the sixth edition of the IPC.
(2) Extracting patents relevant to the four priority technology sectors
Next, I created filtering programs to find patents in the four technology categories designated as priority areas in the government's "Second Science and Technology Basic Plan" - biotechnology, information technology, nanotechnology and environmental technology - and extracted patents in these categories from the database.
The filtering program for biotechnology patents was based on an algorithm made to resemble Anderson's study as much as possible. I thus extracted patents that either fell under a very narrow area of the international technology classification within the IPC, or included keywords related to the human genome.
For IT-related patents, I used "G06F: Electrical digital data processing" and "H01L: Semiconductor devices; electric solid-state devices not otherwise provided for" under the international technological classification. These technological areas are only a part of the IT sector and this should be borne in mind when interpreting the results. The filter used was of my own design.
The filter for nanotechnology patents was based on the filter used in the "Survey of Technology Trends Regarding Nano-level Material Technology" (June 5, 2001) conducted by the Technology Evaluation and Research Division of the Ministry of Economy, Trade and Industry's Industrial Science and Technology Policy and Environment Bureau.
For environmental technologies, I extracted patents that fell under "ZAB: Those related to environmental protection technologies" under the "faceted classification codes" that the Japan Patent Office has established based on different standards from the IPC, and which it uses together with those of the IPC.
(3) Extracting samples by random sampling
From the patent sets for the categories of biotechnology, IT, nanotechnology and environmental technology, I extracted 300 patents from each category and 300 patents from the entire patent set (regardless of sector) for comparison purposes via random sampling using pseudo-random numbers. In other words, a total of 300 x 5 (the four priority categories + all categories) = 1,500 patents were included in the sample.
(4) Visually measuring science linkage
Finally, I visually extracted all the other patents and papers cited in the full text of these 1,500 patent samples and analyzed trends within them. Specifically, I read the text files of each of the 1,500 patents, found citations, extracted the cited literature, created a separate file, and classified them into patents and academic papers.
Results
Both in terms of the percentage of sample patents that cited academic papers (the ratio of science-based patents) and the average number of papers cited per patent (science linkage) I discovered a clear trend. From highest to lowest, the patent categories with the greatest science linkage were: biotechnology, nanotechnology, IT and environmental technology. This trend was unchanged regardless of whether the patents were applied for according to the provisions of the Patent Cooperation Treaty.
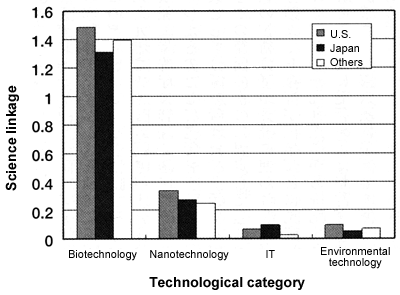
In order to analyze why the science linkage differed so markedly depending on the technology category of the patent, I looked at the nationalities of the patent applicants. The addresses of 50% of the applicants for biotechnology patents were located outside Japan. The corresponding figures for nanotechnology, IT and environmental technology were 28%, 13% and 12%, respectively. However, when I classified the sample patents in the four sectors by the applicants' nationality, I found that while the degree of science linkage differed between categories, the trend in the differences in science linkage among the four sectors was the same for every nationality: Biotechnology exhibited a high degree of science linkage, followed by nanotechnology, with IT and environmental technology showing less linkage.
I also counted the number of claims requested in each of the 1,200 sample patents in the four priority sectors and analyzed their relationship with science linkage. As a result, I found that because both science linkage and the number of claims per patent are high in patents filed in the U.S., the difference in science linkage by applicant nationality declined, and thus differences among the technology categories was more significant than the nationality of the applicant. Here also, the technology category with the greatest science linkage was biotechnology, followed by nanotechnology (see diagram).
Discussion
From the above data, it is clear that science linkage as measured in the patent samples of the four main technology categories is especially high in the area of biotechnology, followed by nanotechnology, and weaker in the areas of IT and environmental technology. This is true even when the samples are controlled for applicant nationality and the number of claims.
In other words, we have demonstrated that the large gap in science linkage among technological categories is, regardless of the inventor's nationality, based on the essential difference in the process by which the technology in question is created - whether the knowledge the inventor used in the process of creating the technology was scientific knowledge, or knowledge of earlier technologies.
This indicates a difference in the impact that science has on technology depending on the technological category. And the results of this study provide basic quantitative data for discussions on how to implement science and technology policies in the future according to the distinct characteristics of each category.
Specifically, the fact that science linkage is especially strong in the area of biotechnology may indicate that new inventions are based on a wealth of scientific knowledge. This is consistent with the fact that biotechnology is considered a science-oriented industry, and the tendency for biotechnology ventures to spring up and form clusters around leading universities. When drawing up policies for industry-university cooperation and for regional promotion such as regional clusters, it is necessary to pay closer attention to the characteristics of each technological category, based on the fact that science linkage greatly differs depending on the technology concerned.
This study has also clearly shown that in discussions of science linkage, we must bear in mind that such linkage greatly differs depending on the technological category. For example, we sometimes hear the argument that the U.S. is ahead of other countries in utilizing science in developing technology because its average science linkage is higher than that of other nations. However, it may be that science linkage is increasing in the U.S. simply because applications for biotechnology patents are increasing faster than those for other types of technology.
Lastly, I would like to touch upon the limits to research using science linkage. As mentioned above, science linkage is an indicator of the extent to which the scientific knowledge in theses and other academic papers are cited in patented technological knowledge. Just as one cannot measure height with a scale, the only thing that science linkage measures is the number of papers cited in a patent. For example, in the field of IT, where many companies are actively pursuing research, even very basic ideas are not released as papers, but are first submitted as patent applications. In such cases, there are no academic papers to cite, and as a result degree of science linkage in this technological category is lower. About ¥12 trillion of the roughly ¥15 trillion that Japan spends on research and development are outlays by private corporations. In other words, companies comprise a large part of Japan's innovation system and analyzing science linkage alone will not serve to accurately measure technological innovation in the corporate sector. Future research should combine science linkage with other indicators, such as surveys of research and development within corporations, and analysis of citations of previous patents.