
Forecasts of business conditions affect investment decisions. This column provides evidence that this is the case in Japan, using firm-level data collected between 2004 and 2014 covering several significant economic events. It also shows that the impacts of business condition forecasts on investment are similar across manufacturing and non-manufacturing industries.
In recent years, advanced economies have experienced uncertainty shocks repeatedly, such as the Global Crisis, the Eurozone Crisis, and the ‘fiscal cliff’ in the United States (in 2012). The Japanese economy has been affected not only by these global events, but also by shocks specific to Japan including the transfer of political power between the Liberal Democratic Party and the Democratic Party (2009, 2012) and the 2011 Great East Japan Earthquake. Using data from a quarterly business survey in Japan, we construct a measure of business uncertainty and analyse the time-series properties of uncertainty and its relationship with investments.
How to measure economic uncertainty
Theoretically, because of the irreversibility and adjustment costs of investment, economic uncertainty has a negative effect on investment. This mechanism is referred to as the option value of waiting. Empirical studies generally support this theoretical prediction that uncertainty has a negative impact on equipment investment, research and development (R&D) investment, and hiring of employees. In the empirical studies, various proxies of uncertainty have been developed and employed, such as volatility of stock prices, the unexplained portion of macroeconomic variables derived from econometric models, the cross-sectional disagreement of economic forecasts, or the frequency of newspaper articles regarding uncertainty (see Bloom 2014 and Jurado et al. 2015, for surveys).
Among the alternative proxies of uncertainty, following Bachmann et al. (2013) and Arslan et al. (2015), we use firms' ex post forecast errors to construct our measure of economic uncertainty (Morikawa 2016). In order to create the uncertainty measure, we utilise company-level information from the Tankan survey, a nationally representative quarterly business survey in Japan conducted by the Bank of Japan. While past studies using firm survey data focus only on the manufacturing sector, our study covers both manufacturing and non-manufacturing sectors, enabling us to make a comparison between industries.
Construction of the uncertainty measure
Our study uses originally compiled data for firms' judgement of business conditions as well as their planned fixed-asset investments for the period from 2004 Q1 to 2014 Q3. In the Tankan survey, the questionnaire about the judgement of business conditions is in the style of multiple choice: (1) favourable, (2) not so favourable, and (3) unfavourable. Importantly, the survey asks about the current and forecast conditions for the next quarter. We compile the cross tabulations of the judgement of the current condition in the current survey and the forecast judgement in the previous quarter. By this cross tabulation, we obtain a 3×3 matrix of the number of firms for each quarter.
Following Bachmann et al. (2013), we calculate forecast error dispersion (FEDISP) based upon ex post forecast errors of individual firms calculated from two consecutive surveys. If a firm's current judgment is the same as the forecast judgment made in the previous survey, '0' is assigned to the firm. If the current judgment improves (deteriorates) by one unit compared with the forecast judgment, ‘+1’ (‘−1’) is assigned to the firm. When the improvement (deterioration) is two units, ‘+2’ (‘−2’) is assigned. Then FEDISP is calculated as the standard deviation of these forecast errors. Intuitively, FEDISP, which indicates business uncertainty at the time of forecasting, exhibits a large value when the number of firms making upward errors and those making downward errors in the next quarter are both large.
Movements of business uncertainty in Japan
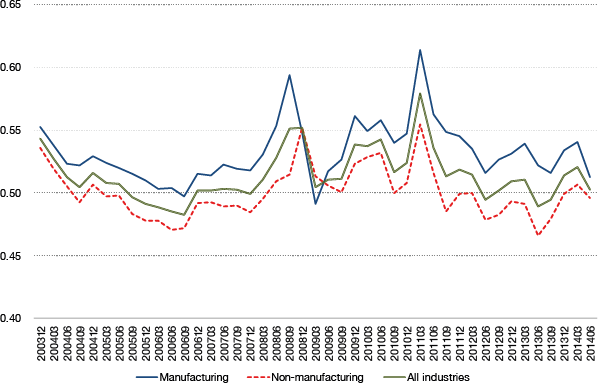
The movements of the FEDISP throughout the sample period are depicted in Figure 1 by industry. During the long business upturn in the middle of the 2000s, the uncertainty index was low and stable. In this period, political power had also been stable under the long-lasting Cabinet of former Prime Minister Junichi Koizumi. However, this uncertainty index increased in the periods of the Global Crisis and the Great East Japan Earthquake. On the other hand, the increase in uncertainty was small after the announcement of the quantitative and qualitative monetary easing policy under Abenomics. Similarly, there was a small rise in business uncertainty at the time of an increase in the consumption tax rate from 5% to 8% in April 2014, which was an anticipated event.
Comparing by industry, manufacturing firms generally exhibit higher levels of business uncertainty than non-manufacturing firms throughout the sample period. This difference can be interpreted as manufacturing firms being affected invariably by global economic fluctuations and exchange rate movements, even in normal times.
Business uncertainty and investments
Next, in order to test the negative impact of uncertainty on firms' investments, we conduct a regression analysis on the association between FEDISP and the revision rate of the investment plan from the previous quarter. Some other variables, such as the change in the actual business conditions from the previous quarter and the expected change in business conditions, are used as controls in order to abstract pure uncertainty effects.
As expected, the coefficient for the uncertainty measure is negative and statistically significant at the 1% level. Quantitatively, a one-standard deviation larger uncertainty is associated with 2.8 percentage point downward revisions of the investment plan, which is about 40% of a standard deviation of the revision rates. Obviously, the impact of uncertainty on the investment plan is non-negligible.
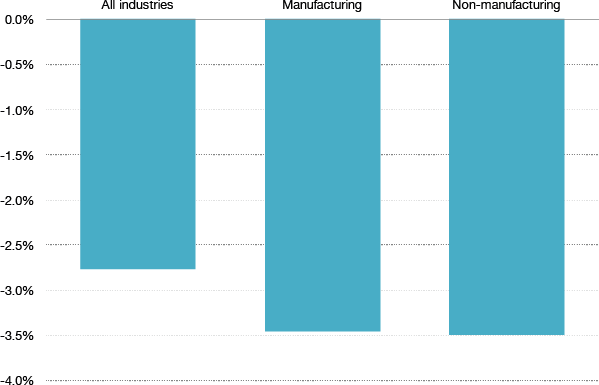
According to the regression results for the subsamples of manufacturing and non-manufacturing firms, the estimated coefficients for FEDISP are negative and significant for both sectors. The quantitative magnitudes of one-standard deviation larger uncertainty with the revision rate of the investment plans are remarkably similar for both industries: about 3.5 percentage points downward revisions (see Figure 2). These results suggest that maintaining a stable macroeconomic environment and avoiding unpredictable conduct of economic policies are essential for promoting private firms' investments.
This article first appeared on www.VoxEU.org on April 11, 2016. Reproduced with permission.