
In China, with the increasing marketization of the economy, major "prices" such as interest rates, the renminbi (RMB) exchange rate (against the U.S. dollar), and stock prices have become greatly influenced by economic trends such as the inflation rate and economic growth measured in terms of real gross domestic product (GDP). In economics textbooks, how interest rates are being affected by changes in the inflation and economic growth rates is presented in the form of a formula called the Taylor Rule. In this article, I will apply this formula to China and explain how, in addition to interest rates, the RMB exchange rate and stock prices respond to changes in the inflation and economic growth rates by using the statistical method of regression analysis. The period examined is from the third quarter of 2005, which began in July 2005 when China shifted from the dollar-peg regime to the managed floating exchange regime, to the fourth quarter of 2011.
Determinants of interest rates
To begin with, Chinese banks' deposit and lending rates remain subject to control by the monetary authority, and the adjustment of interest rates serves as one of the key instruments of monetary policy. In order to maintain the stability of the macro economy, the monetary authority raises interest rates when the economic growth and inflation rates go up. Conversely, when the economic growth and inflation rates go down, they respond by lowering interest rates.
In order to confirm this, we conducted regression analysis taking the benchmark interest rate on one-year bank loans as an explained variable and the year-on-year change in the rate of inflation (measured by the consumer price index) and that in the economic growth rate as explaining variables. In consideration of monetary policy inertia, we also used the benchmark lending rate in the preceding quarter as the third explaining variable. Our estimation results show that the monetary authority raises (lowers) interest rates by 0.11 percentage points in response to a one percentage point increase (decrease) in the inflation rate, and by 0.08 percentage points in response to a one percentage point increase (decrease) in the economic growth rate (Figure 1).
Figure 1: Estimation of banks' benchmark lending rate based on the Taylor Rule |
 |
Note: Estimation based on the following regression analysis equation. The benchmark lending rate is for one-year bank loans, and the quarterly figures are calculated as the average of the end-of-month values of the respective quarters. Estimation period: 3Q/2005 to 4Q/2011 |
| Source: Estimated and compiled by the author based on data from a CEIC Database. |
Determinants of the RMB exchange rate
Economic trends have a significant impact not only on interest rates but also on the foreign exchange rates. In order to confirm this, we conducted regression analysis taking the year-on-year change in the RMB exchange rate against the U.S. dollar as an explained variable and the year-on-year changes in the inflation and economic growth rates as explaining variables. In consideration of the time lag between different variables and exchange rate inertia, the inflation rate of the preceding quarter, rather than that of the current period, was used, and the RMB exchange rate against the U.S. dollar in the preceding quarter was added as an explaining variable. Our results show that the RMB exchange rate against the U.S. dollar rises (drops) by 0.54% year-on-year in response to a one percentage point increase (decrease) in the prior-quarter inflation rate, and by 0.24% in response to a one percentage point increase (decrease) in the economic growth rate (Figure 2).
Figure 2: Estimation of the RMB exchange rate against the U.S. dollar based on the Taylor Rule |
 |
Note: Estimation based on the following regression analysis equation. The RMB exchange rate against the U.S. dollar is the average rate for each quarter. Estimation period: 3Q/2005 to 4Q/2011 |
| Source: Estimated and compiled by the author based on data from a CEIC Database. |
In particular, when we compare the year-on-year changes in the RMB exchange rate against the U.S. dollar since July 2005 and those in the inflation rate, we can see that the higher the inflation rate, the greater the pace of RMB appreciation against the U.S. dollar (Figure 3). This is contrary to the market principle and reflects the fact that the RMB exchange rate is being used as a tool to maintain price stability.
Figure 3: Rate of RMB appreciation against the U.S. dollar moving in tandem with the inflation rate |
 |
| Note: The RMB exchange rate against the U.S. dollar represents the monthly average. |
| Source: Compiled by the author based on data provided by the National Bureau of Statistics and the State Administration of Foreign Exchange (SAFE) of China. |
Determinants of stock prices
Just like interest rates and foreign exchange rates, stock prices in China are affected significantly by economic trends. In order to confirm this, we conducted regression analysis taking the quarter-to-quarter change in the Shanghai Stock Exchange (SSE) Composite Index as an explained variable and the year-on-year changes in the economic growth and inflation rates as explaining variables. We found that the SSE Composite Index rises (drops) by 5.37% quarter-to-quarter in response to a one percentage point increase (decrease) in the economic growth rate, whereas the index falls (rises) by 3.62% in response to a one percentage point increase (decrease) in the inflation rate (Figure 4). Estimated values obtained from this estimating equation show movement in the same direction (up or down) as actual values in 21 out of the total 26 quarters with inconsistent movements observed only in the remaining five quarters. It is fair to say that the accuracy of the estimation is extremely high.
Figure 4: Changes in the SSE Composite Index —Actual versus estimated values— |
 |
Note: Estimation based on the following regression analysis equation. The SSE Composite Index is provided in the quarterly average. Estimation period: 3Q/2005 to 4Q/2011 o: Estimated and actual values move in the same direction, either upward or downward. x: Estimated and actual values move in opposite directions. |
| Source: Estimated and compiled by the author based on data from a CEIC Database. |
Actually, the SSE Composite Index followed an upward trend from the first quarter of 2006 through the fourth quarter of 2007 and from the first quarter through the fourth quarter of 2009, whereas the index was on a downward trend from the first quarter through the fourth quarter of 2008, and it has been in a downtrend again from the first quarter of 2010 onward. Each of the two uptrend periods started with low inflation, went through a high growth phase, and ended under high inflation (Figure 5).
Figure 5: Changes in stock prices, real GDP growth rate, and CPI inflation rate in China |
 |
| Note: Shaded areas indicate the uptrend. |
| Source: Compiled by the author based on data from a CEIC Database. |
Outlook for interest rates, the RMB exchange rate, and stock prices
As discussed to this point, the levels of interest rates, the RMB exchange rate, and stock prices in China are all dependent on the business cycle. In the fourth quarter of 2011, the Chinese economy posted a year-on-year growth of 8.9%, the lowest since the second quarter of 2009. Meanwhile, the inflation rate remains fairly high though down from its peak of 6.3% in the third quarter of 2011. If we use the post-Lehman average rates (9.4% for the economic growth rate and 2.7% for the inflation rate) as the benchmark, the Chinese economy is now in a stagflation phase characterized by low economic growth and high inflation (Figure 6). The inflation rate, which is a lagging indicator of the business cycle, is expected to decline further, and the Chinese economy will likely move into a recessionary phase at some point in the first half of 2012. In this stage, the Chinese authority is expected to ease the monetary policy and lower interest rates. With this serving as a trigger, the economy should enter into a recovery phase, a period of high growth and low inflation, in the second half of 2012.
Figure 6: Difference stages of the business cycle in post-Lehman China |
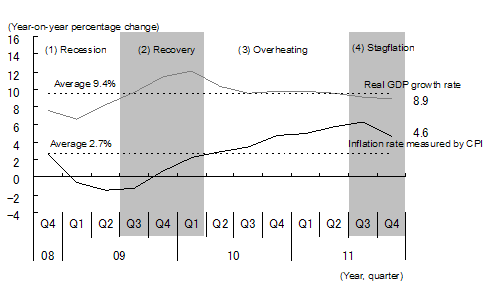 |
| Note: Stage (1) is characterized by low economic growth and low inflation, (2) by high economic growth and low inflation, (3) by high economic growth and high inflation, and (4) by low economic growth and high inflation. |
| Source: Compiled by the author based on data from a CEIC Database. |
The pace of RMB appreciation against the U.S. dollar is likely to slow down in the first half of 2012, as the economy is expected to enter a recessionary phase characterized by low economic growth and low inflation. At the same time, stock prices are expected to bottom out, benefiting from low inflation and monetary easing. However, we will probably have to wait for the arrival of a recovery phase sometime in the second half of the year to see a full-fledged bull market.