Thanks to weak overseas economies and the restrictive monetary policy pursued since early 2010 in a bid to cool down its overheated economy, economic growth in China has been slowing. The inflation rate, which had been rising, also began falling from its peak in July 2011. In response, the government's monetary policy stance is shifting from tightening to easing, as observed in the recent cut in the reserve requirement. Although the economy is likely to continue to slow for now, it is expected to bottom out in the first half of 2012 and recover ahead of the National Congress of the Communist Party of China (Party Congress) to be held in the fall, given the adoption of further credit easing including rate cuts and an expansionary fiscal policy.
Economic slowdown more evident
The Chinese economy slowed temporarily in the wake of the collapse of Lehman Brothers in September 2008, with its growth rate falling to 6.6% in the first quarter of 2009. However, it then achieved a V-shaped recovery driven by economic stimulus measures of four trillion yuan and a loose monetary policy, with economic growth reaching 11.9% in the first quarter of 2010. Subsequently, however, growth started to decelerate, falling to 9.1% in the third quarter of 2011, the lowest level since the second quarter of 2009. This reflected the following factors: another global economic turmoil, this time triggered by the sovereign debt crisis in Europe; the fading effect of domestic economic stimulus measures; and a shift in monetary policy from easing to tightening in order to control inflation.
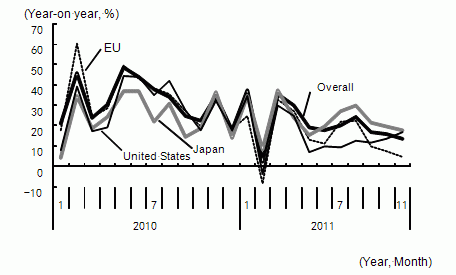
Economic conditions have been deteriorating further since entering the fourth quarter of 2011. Growth (year-on-year) in industrial production (in value-added terms, only for enterprises larger than a certain size) has been declining from 13.8% in the third quarter to 13.2% in October and further to 12.4% in November. Although domestic demand has been relatively strong, owing to growth in retail sales and fixed-asset investment in urban areas, growth in exports (in dollar terms) has been decelerating from its latest peak of 24.5% in August 2011 to 13.8% in November, reflecting depressed overseas economies in regions such as Europe (Figure 1). The fall in external demand has been pushing down growth in industrial production.
Figure 1: Slower Growth in Exports Becoming More Evident, Especially to Europe |
 |
| (Source) Customs Statistics of China |
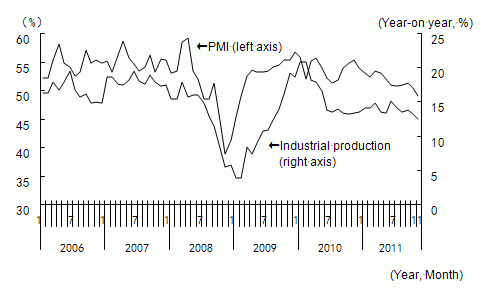
The downward trend in the purchasing managers' index (PMI), a key indicator of economic activity, also suggests a deteriorating economy. In step with slower growth in industrial production, the PMI declined from 50.4% in October 2011 to 49.0% in November, falling below 50%, the dividing line between expansion and contraction, for the first time since March 2009 (Figure 2).
Figure 2: PMI Falling in Step with Slower Growth in Industrial Production |
 |
| (Note) Industrial production is in added value terms (real). |
| (Source) CEIC Database |
Based on economic statistics for October and November 2011, the growth rate is likely to fall even further to around 8.5% in the fourth quarter.
Inflation beginning to ease
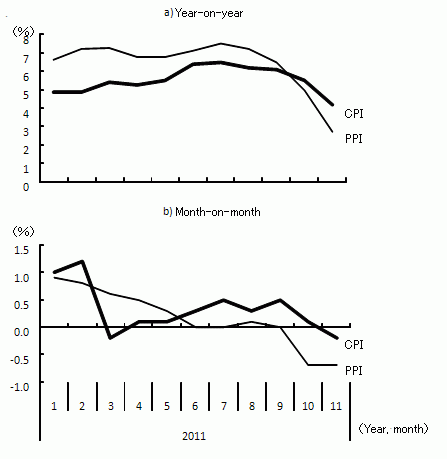
Against a backdrop of credit tightening and an economic slowdown, the year-on-year rate of increase in the consumer price index (CPI) started to decelerate from its peak of 6.5% in July 2011, reaching 4.2% in November (Figure 3). The year-on-year rate of increase in the producer price index (PPI) also declined from a peak of 7.5% in July to 2.7% in November. The increase in CPI and PPI has also been slowing on a month-on-month basis. For the following reasons, it looks likely that inflation will continue to fall in the months ahead.
Figure 3: Growth in CPI and PPI Starts to Decelerate |
 |
| (Source) CEIC Database |
First, economic growth is continuing to decelerate, and upward pricing pressure is being eased by the improving supply-demand balance in the market. As the inflation rate is considered a lagging indicator of growth, it should fall further in the months ahead, reflecting a decline in the growth rate to date.
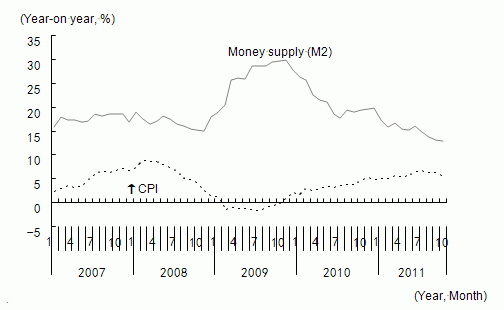
Second, year-on-year growth in money supply (M2) fell from 29.7% in November 2009 to 12.7% in November 2011, with credit tightening proving effective. According to the conventional economics wisdom, namely that inflation is always a monetary phenomenon, the soaring inflation since 2010 is a result of credit easing in the wake of the global financial crisis, and recent slower growth in the money supply, by contrast, should translate into lower inflation (Figure 4).
Figure 4: Inflation Pressure Decreasing with Slower Growth in Money Supply |
 |
| (Source) The National Bureau of Statistics of China |
Third, rising food prices, which had been pushing up inflation, have subsided. Food accounts for approximately 30% of the goods and services that comprise the CPI, and about 70% of the rise in the CPI thus far was related to the rise in food prices. As in the overall CPI, however, the rate of increase in food prices has also started to decelerate from its peak in July (14.8% year-on-year), falling to 8.8% in November. The rise in food prices is expected to ease further, given the changing supply-demand conditions, with the demand for food falling as the economy slows, and the supply of food increasing as migrant workers who have lost their jobs in the city return to farming.
Finally, international commodity markets have fallen as the global economy has slowed. This is weakening import inflation pressure in China.
From stagflation to recession
Although the current growth rate is lower than the average of 9.5% for the period after the Lehman Brothers collapse, the inflation rate is still above the average of 2.5%, albeit having peaked. In terms of the business cycle, the Chinese economy has entered a phase of stagflation with low growth and high inflation, after a phase of overheating with high growth and high inflation (from the second quarter of 2010 to the second quarter of 2011) (Figure 5 and Figure 6). The economy is likely to enter a phase of recession with low growth and low inflation at the beginning of 2012, given that the effects of the restrictive monetary policy in the past are becoming more pronounced moving forward.
Figure 5: Economic Phases in China after the Global Financial Crisis —Changes in GDP Growth and Inflation— |
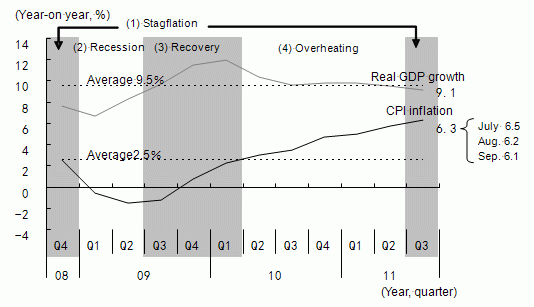 |
| (Note) (1) represents low growth and high inflation, (2) low growth and low inflation, (3) high growth and low inflation, and (4) high growth and high inflation. |
| (Source) CEIC Database |
Figure 6: Cyclical Changes in GDP Growth and Inflation in China after the Global Financial Crisis |
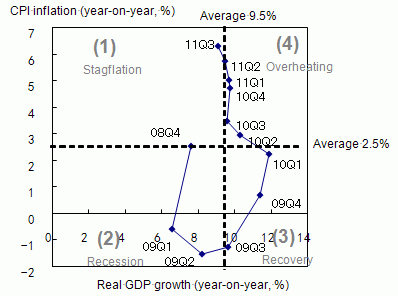 |
| (Note) (1) represents low growth and high inflation, (2) low growth and low inflation, (3) high growth and low inflation, and (4) high growth and high inflation. The economy circulates counterclockwise in the order of (1) > (2) > (3) > (4) > (1). |
| (Source) CEIC Database |
Monetary policy shifting from tightening to easing
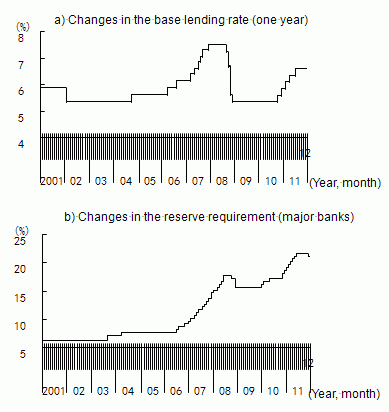
Monetary policy has a strong impact on the economy on one hand, and it is adjusted with changes in economic conditions on the other. China was quick to adopt credit easing after the Lehman Brothers collapse, cutting interest rates and the reserve requirement. Up to December 2008, the base lending rate (one year) was cut five times for a total of 2.16 percentage points, while the reserve requirement was reduced three times for a total of two percentage points. Subsequently, the monetary authorities changed the direction of the policy toward credit tightening, following the economic recovery and accelerating inflation. More specifically, they raised the reserve requirement 12 times for a total of 6 percentage points from January 2010 to June 2011 and the base lending rate five times for a total of 1.25 percentage points from October 2010 to July 2011 (Figure 7).
Figure 7: Monetary Policy Trends —Changes in Interest Rates and Reserve Requirement— |
 |
| (Source) Data from the People's Bank of China |
However, as the economy worsened and inflation started to decelerate, the authorities finally announced on November 30, 2011 that they would cut the reserve requirement by 0.5 percentage points (implemented on December 5). This means that the authorities' stance on monetary policy is shifting from tightening to easing. Reserve requirement is expected to be cut further going forward, in step with the falling inflation, and interest rate cuts are approaching. The economy is likely to bounce back toward the Party Congress to be held in the fall of 2012 because of further credit easing.
Economy to recover toward the Party Congress in the fall of 2012
The Party Congress, which is held every five years, will be a golden opportunity for the Communist Party to showcase its economic achievements and for the next generation of leaders to enter the central government using their achievements in local governments as leverage. Reflecting this, in years when the Party Congress is held, China tends to adopt expansionary fiscal and monetary policies, and the growth rate tends to be higher. While the average growth rate in China from 1981 to 2010 is 10.1%, the average growth rate for the six years when the Party Congress has been held (1982, 1987, 1992, 1997, 2002, and 2007) is 11.3%, 1.2 percentage points higher. Indeed, growth reached 14.2% in 2007 when the previous Party Congress was held (Figure 8). As China is likely to pursue expansionary fiscal and monetary policies again in 2012, the economy is expected to enter a recovery with high growth and low inflation once again toward the Party Congress in the fall.
Figure 8: Business Cycle in China in Tandem with the Party Congress |
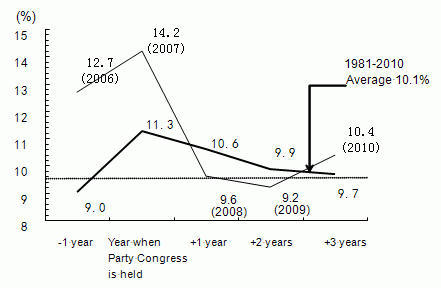 |
| (Note) Real GDP growth. The thick line shows the average for the reference years (the period is from 1981 to 2010). For example, the value for the years when the Party Congress was held represents the average growth rate for 1982, 1987, 1992, 1997, 2002, and 2007. The thin line shows the value in each year from 2006. The Party Congress is held every five years, and the previous one (17th) was held in October 2007. |
| (Source) China Statistical Yearbook 2011 of the National Bureau of Statistics of China |
Average GDP growth in the United States is 2.9% for the period from 1976 to 2010, while the average for election years during the same period is higher at 3.5% (Figure 9). The peaks of the "political business cycles" in the United States and China will overlap each other in 2012 for the first time in 20 years. If the United States and China, the world's largest and second-largest economies respectively, enjoy a boom at the same time as the historical pattern suggests, it will be good news for the global economy, which has been mired in a long slump.
Figure 9: Business Cycle in the United States in Tandem with Presidential Elections |
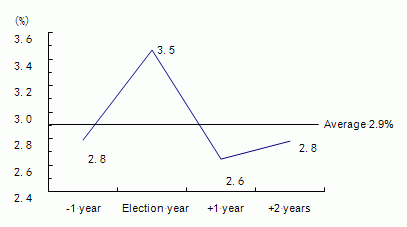 |
| (Note) Average real GDP growth. The period is from 1976 to 2010. |
| (Source) Data from the U.S. Bureau of Economic Analysis |
The original text in Japanese was posted on December 27, 2011


