The potential for a ballooning global imbalance to destabilize the world economy has long been a concern. This fear became a reality when the current global financial crisis was triggered by the subprime mortgage loan crisis. At the core of this global imbalance are the trade deficit of the United States and the trade surplus of China. The former mainly reflects a savings shortfall (excessive consumption) in the United States, while the latter is a result of excessive savings (consumption shortfall) in China. Redressing the imbalance requires suppressing consumption in the United States and increasing consumption in China. Signs that this is happening finally began to emerge following the Lehman shock in September 2008.
Global imbalance centers on the U.S. and China
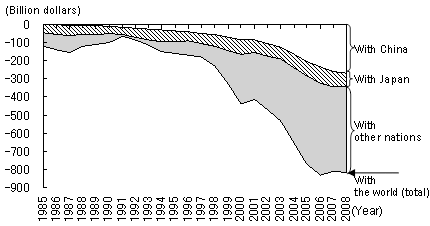
Together, the large U.S. trade deficit and China's rising trade surplus have become a symbol of the global imbalance. On a customs-clearance basis, the U.S. trade deficit reached $816.2 billion in 2008 and China's trade surplus hit $295.5 billion. On a bilateral basis, China replaced Japan in 2000 as the trade partner with whom the U.S. had the largest deficit, and by 2008 the U.S. deficit with China reached $268 billion, accounting for 32.8% of its total deficit ( figure 1 ).
Figure 1: Increasing U.S. trade deficit with China, Japan, and the rest of the world

(Source) Prepared based on Foreign Trade Statistics, U.S. Census Bureau
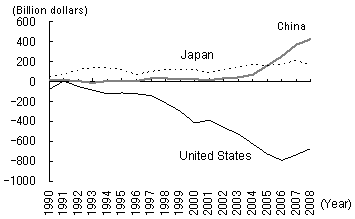
China and the United States also stood in marked contrast in recent years in terms of their current account balances (which include, in addition to the balance of trade, the balance on the services account, the balance on factor income from overseas, and the balance on the transfer account). The U.S. deficit has been expanding sharply (to $673.3 billion in 2008) while China's surplus has been rising (to $426.1 billion in 2008). Indeed, China has been the country with the largest current account surplus since 2006 when it surpassed Japan ( figure 2 ).
Figure 2: Changes in the current account balances of Japan, the United States, and China
 div class="tagger" style="width:355px">
(Source) China's statistics based on China Statistics Summary 2009; Statistics for the U.S. and Japan based on the International Monetary Fund's World Economic Outlook Database, April 2009
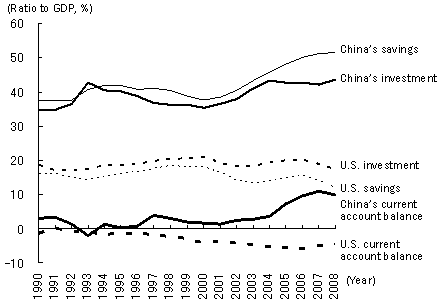
The sharply rising current account imbalances of China and the United States reflect the respective widening savings-investment gaps in the two countries ( figure 3 ). While both the ratio of domestic savings and the ratio of domestic investment to GDP have been rising in China since 2000, the savings ratio has been climbing faster than the investment ratio. As a result, the current account surplus as a percentage of GDP has been rising rapidly, reaching 9.8% in 2008. Meanwhile in the United States, although the ratio of domestic investment has remained at around 20%, the current account deficit as a percentage of GDP has climbed to 4.7% by 2008, reflecting a fall in the domestic savings ratio.
Figure 3: Changes in current account balances in China and the United States reflecting the savings-investment balance

(Note) Current account balance = savings - investment
(Source) China's statistics based on China Statistics Summary 2009; Statistics for the U.S. and Japan based on the International Monetary Fund's World Economic Outlook Database, April 2009
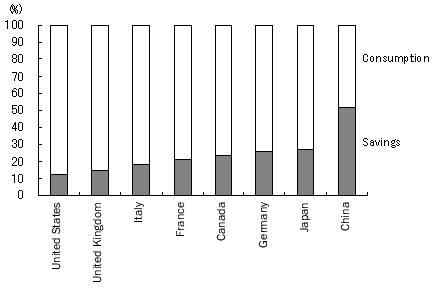
Thus the rising savings ratio (equating to a falling consumption ratio) in China and the falling savings ratio (equating to a rising consumption ratio) in the United States are the most critical factors in the expansion of the global imbalance. In fact, a comparison of major countries in 2008 shows that the United States had the lowest savings ratio while China had the highest. At the same time, the United States had the highest consumption ratio and China the lowest ( figure 4 ).
Figure 4: Comparison of the ratios of savings and consumption to GDP in major countries (2008)

(Note) Current account balance = savings - investment
(Source) China's statistics based on China Statistics Summary 2009; Statistics for the U.S. and Japan based on the International Monetary Fund's World Economic Outlook Database, April 2009


