
In recent years, India has come to attract attention as a major power that is achieving high growth, and together with China, Russia, and Brazil now forms what is called the BRIC economies. Many Japanese companies are increasing investment in India as part of their "China plus one" strategy, which aims to disperse risk, especially after the anti-Japan demonstrations in China in the spring of 2005. According to the "Survey Report on Overseas Business Operations by Japanese Manufacturing Companies" released by the Japan Bank for International Cooperation in November 2006, the percentage of firms that consider India as a promising country for conducting business in the medium term (the next three years) rose to 47% from 24% in 2004, while the figure grew to 67% from 41% for the long term (the next 10 years). In contrast, the percentage of companies that see China as a promising country for business in the medium term fell to 77% from 91% and to 74% from 85% for the long term. Will the day come when India replaces China as the major recipient of Japanese investment? Let us examine this issue by comparing the two countries' key economic indicators (table).
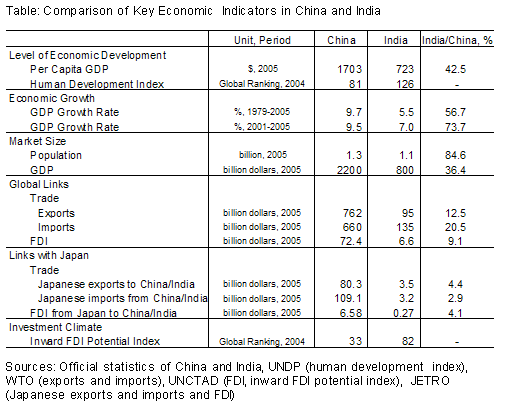
Level of Economic Development
In the 1970s, per capita GDP in China and India were at about the same level, but the gap between the two has continued to widen, and in 2005 China's per capita GDP stood at $1,703, compared to $723 for India. When we compare the "Human Development Index (HDI)" released by the United Nations Development Programme (UNDP) (Human Development Report, 2006), which combines per capita GDP (in Purchasing Power Parity terms) with other factors such as life expectancy and education levels, China ranked 81st among the 177 nations covered in 2004, while India languished in 126th place. When comparing the HDI, India cannot even draw level with Guizhou province, where per capita income is the lowest in China, a country with huge regional disparities. In addition, India's level of development in 2004 was generally on a par with that of China in 1986, and there is a roughly 18-year difference between the two nations.
Economic Growth
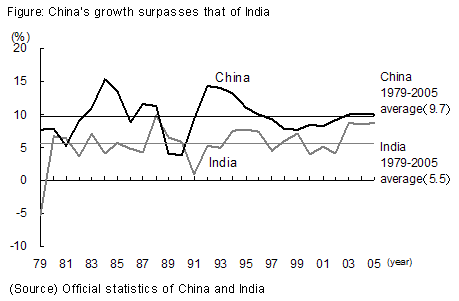
China's economy has grown at an average pace of 9.7% between 1979 and 2006, much faster than India's 5.5%. While India's growth has been accelerating to 8% levels since 2003, it still does not match that of China (figure). When we also consider the fact that India's population is increasing at a pace roughly 1% faster than that of China, the difference in growth in per capita GDP terms becomes larger.
Market size
India has a population of 1.1 billion, and is a major population power on a par with China (1.3 billion). In recent years, China's population growth rate has fallen to 0.6%, while India's remains high at 1.6%. According to United Nations projections, India will overtake China to become the world's most populous country in 2030. On the other hand, China's GDP was $2.2 trillion in 2005, fourth in the world after the United States, Japan and Germany, while India's remains at $800 billion.
Global Links
According to World Trade Organization (WTO) statistics, China's trade came to $1.42 trillion ($762 billion in exports, $660 billion in imports) in 2005, surpassing Japan to become third in the world behind the U.S. and Germany. In comparison, India's exports totaled $95.1 billion (29th in the world) and its imports $134.8 billion (17th in the world). In terms of manufactured goods, India exported $69.8 billion, a scant 10% of China's exports ($700.3 billion). On the other hand, according to the World Investment Report issued by the United Nations Conference on Trade and Development (UNCTAD), both China and India logged record-high levels of foreign direct investment inflows in 2005, but there was a tenfold gap between China's $72.4 billion (including investment in financial institutions) and India's $6.6 billion.
Links with Japan
On the trade front, Japan's trade with China in 2005 came to a total of $189.4 billion (17.0% of total trade) - $80.3 billion in exports (13.4% of total exports) and $109.1 billion in imports (21.0% of all exports). China is already Japan's second largest trading partner after the U.S. (17.8% of total trade), and when we consider the fact that China is expected to register growth three to four times that of the U.S., the day it tops the U.S. and becomes Japan's No. 1 trading partner is not that far off. In contrast, Japan's trade with India came to $6.7 billion (0.6% of total trade) - $3.5 billion in exports and $3.2 billion in imports, a meager one-thirtieth of its trade with China. Meanwhile, Japanese investment in China in 2005 came to $6.58 billion (14.5% of total outward direct investment), and China is the second largest recipient of Japanese direct investment after the U.S. In comparison, Japanese investment in India is only $270 million (0.6% of the total).
Investment Climate
UNCTAD annually compiles the "Inward FDI Potential Index" as a comprehensive indicator that appraises countries' investment environments and releases it in the World Investment Report (note). According to the latest report (2006), in terms of world rankings based on the indexes, China rose to 33rd from 64th place during the period between 1995 and 2004, while India rose to 82nd from 93rd place. However, the gap between the two is widening rather than narrowing, indicating that China's predominance will remain unshaken.
This shows that in terms of the stage of development, growth potential, market size, relations with the world and Japan, and investment environment, the gap between India and China is obvious. Japanese investment in India will probably increase to some extent in future, but it is difficult to imagine that this will lead to a reduction in investment in China.