I. Introduction
In China, the implementation of the one-child policy since 1980 has changed the demographics of the country dramatically. Initially, the decline in the proportion of the child population to the total population outpaced the increase in the proportion of the elderly population, and the proportion of the working-age population continued to increase, resulting in a pronounced demographic bonus favorable to economic development. Subsequently, however, this trend has reversed, and the share of the working-age population in the total population began a downward trend after peaking in 2007.
The low birthrate and aging population have already become a constraint on economic growth in China. In addition to measures to increase the labor force, such as encouraging childbearing and extending the retirement age, measures to deal with this issue must include enhancing productivity through accelerated innovation and industrial upgrading. While low birthrates and population aging are phenomena common to developed countries, China has to face this severe challenge before it becomes affluent.
Japan has entered a phase of low birthrate and aging population one step ahead of China, and the current age structure of China's population is similar to that of Japan around 1990. Since then, the Japanese economy has been in a prolonged slump, and low birthrate and aging population are seen as one reason for this. This paper will compare the demographics of the two countries and examine what lessons China can learn from Japan's experience (Note 1).
II. Decline in Birthrate and Population
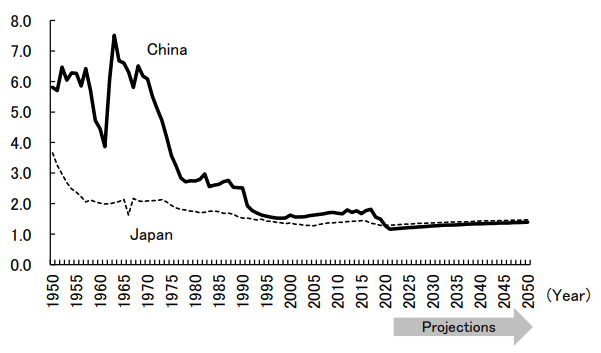
China's birthrate has been declining at a faster pace than that of Japan. This is due to the implementation of population control policies in the form of the one-child policy that began in 1980, as well as the trend toward singlehood, late marriages, and a decline in the average number of children per family. From 1980 to 2020, the total fertility rate in Japan declined from 1.75 to 1.29 (Note 2). During the same period, the total fertility rate in China fell from 2.74 to 1.28, below the Japanese rate. The UN predicts that the total fertility rate in China and Japan will remain at low levels within the timeframe of the projection to 2050 (Figure 1).
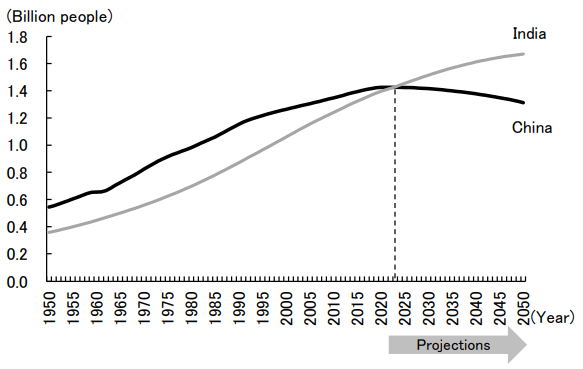
Mainly reflecting a low and falling birthrate, Japan's total population has been declining, and China is entering this phase as well. In Japan, the total population peaked at 128 million in 2009 and had declined to 125 million by 2020. According to the UN projections, it will decrease further to 104 million by 2050. Meanwhile, China's total population grew from 982 million in 1980 to 1.425 billion in 2020, but according to the UN projections, it peaked at 1.426 billion in 2021 and began to decline, to be overtaken by India in 2023 and shrinking to 1.313 billion in 2050 (Figure 2; see BOX for more information on India's demographics).
III. Changes in the Age Structure of the Population
In both China and Japan, low birthrates have not only suppressed population growth, but have also significantly changed the age structure of the population (Figure 3).
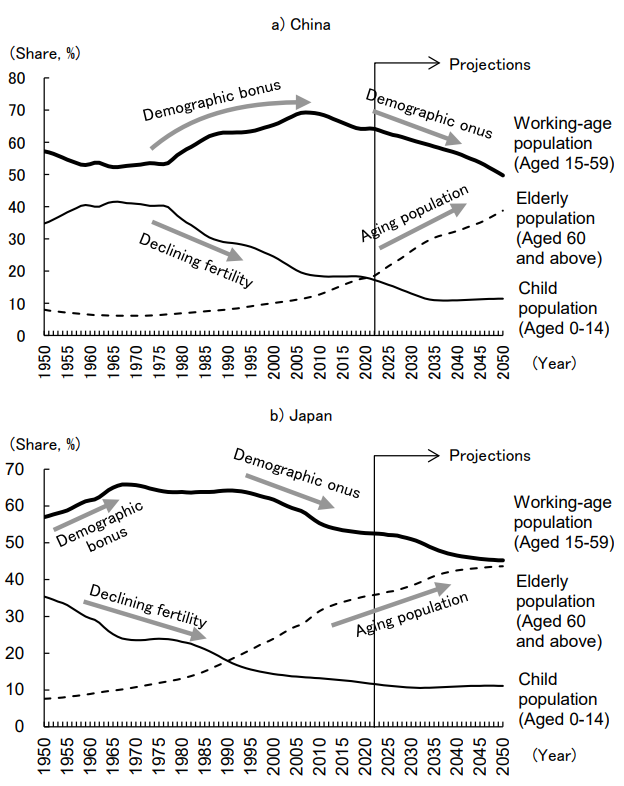
Looking at the three categories of the population: the child population aged 14 and under, the working-age population aged 15-59, and the elderly population aged 60 and over, the proportion of the child population in Japan declined from 23.1% to 11.9% between 1980 and 2020, while the proportion of the elderly population surged from 13.1% to 35.4%. Reflecting the fact that the aging of the population is outpacing the dwindling of child population resulting from the low birthrate, the proportion of the "nonworking-age population," which is the sum of the proportion of the elderly population and the proportion of the child population, has been rising. Conversely, the proportion of the working-age population, which peaked at 65.9% in 1968, declined further from 63.8% to 52.6% between 1980 and 2020.
In China, on the other hand, between 1980 and 2020, the proportion of the child population declined from 36.1% to 18.0%, while the proportion of the elderly population conversely rose from 6.9% to 17.8%. Initially, the proportion of the working-age population rose from 57.0% in 1980 to 69.2% in 2007, reflecting the fact that the pace of decline in the proportion of the child population exceeded the pace of increase in the proportion of the elderly population. Since then, however, the increase in the elderly population has outpaced the decline in the child population, and the share of the working-age population had fallen back to 64.1% by 2020. This means that the demographic bonus that supported economic growth has turned into a demographic onus.
.
In 2020, the proportion of the child population and that of elderly population in China were equivalent to their respective levels in Japan in 1990, and the proportion of the working-age population was equivalent to the 1989 level in Japan. Thus, the age structure of the population in China in 2020 was similar to that of Japan around 1990.
The low birthrate and aging population are expected to continue in both Japan and China in the future. According to the UN projections, in 2050, the proportion of the child population in Japan will fall further to 11.1% and that of the working-age population to 45.2%, while the proportion of the elderly population will rise further to 43.7%. In China, the proportion of the child population will fall further to 11.4% and that of the working-age population to 49.7%, while the proportion of the elderly population will rise to 38.8%.
IV. Rising median age of the population and life expectancy
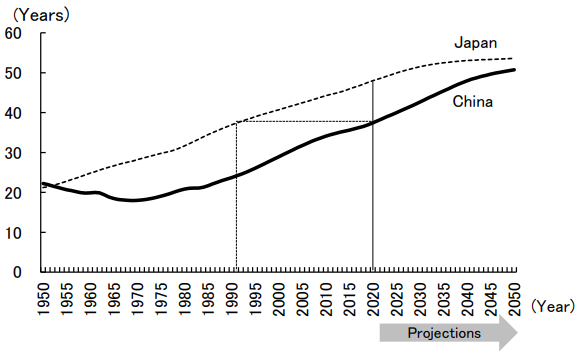
Reflecting the low birthrate and aging population, the median age of the population in Japan and China increased from 31.6 to 48.0 years and from 20.8 to 37.4 years between 1980 and 2020, respectively (Figure 4). China's median age in 2020 was 10.6 years lower than that of Japan's and resembled that of Japan in 1991. According to the UN projections, China's median age will reach 50.7 years in 2050, narrowing the gap with Japan (53.6 years) to 2.9 years.
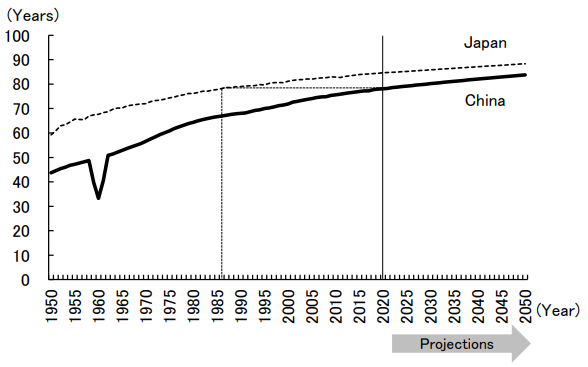
One of the factors contributing to the aging population is the increase in the elderly population due to the rise in life expectancy. Between 1980 and 2020, the life expectancy of the population in Japan increased from 76.1 to 84.7 years, while that in China rose from 64.4 to 78.1 years (corresponding to the 1986 level in Japan), and the gap between the two countries narrowed from 11.7 years to 6.6 years. According to the UN projections, life expectancy in China will increase to 83.8 years by 2050, further approaching the figure in Japan (88.3 years) (Figure 5).
V. Measures to Sustain Growth
Japan's growth rate has been declining since its postwar high-growth period came to an end by the first oil shock in 1973, and the same trend has been observed in China since the beginning of the 2010s. Both reflect a decline in the potential growth rate, which is determined by supply-side factors. In particular, the low birthrate and aging population are suppressing the growth rate through a declining labor force and a lower savings rate (and by extension, investment rate). To sustain economic growth, in addition to the birthrate and the labor participation rate, productivity must also be raised.
Japan has attempted to secure its labor force by encouraging childbearing, promoting employment of women, and extending the retirement age. While encouraging childbearing has yet to halt the decline in the birthrate, promoting female employment and extending the retirement age have had some effect. In China, on the other hand, the labor participation rate of women is already high (but the legal retirement age is low), and there is limited room for further increase, so easing restrictions on childbearing and extending the retirement age are key to resolving labor shortages.
First, regarding the one-child policy, the Third Plenary Session of the 18th Central Committee of the Communist Party of China (CPC) held in November 2013, in an effort to ease the one-child policy, decided on the policy of allowing a second child to be born if one or both people of the married couple is/are an only child/only children. Subsequently, at the Fifth Plenary Session of the 18th Central Committee of the CPC in October 2015, the decision was made to abolish the one-child policy and allow each couple to have two children, which was implemented on January 1, 2016, through amendments to the "Population and Family Planning Law". Furthermore, in May 2021, the Central Political Bureau meeting announced the policy of allowing each couple to have up to three children. However, despite the gradual relaxation of the one-child policy, the birthrate in China has not recovered at all. Given the severity of the problem, birth control will eventually be abolished altogether.
Regarding the extension of the retirement age, the gradual increase in the legal retirement age is included in the 14th Five-Year Plan (2021-2025) as a policy issue. The current legal retirement age in China is 60 for men, 55 for female executives, and 50 for female workers. This was determined when the People's Republic of China was first founded, based on various factors such as life expectancy, working conditions, and employment methods. However, as the supply of labor has been decreasing due to the low birthrate and aging population, while life expectancy has been increasing, the shortage of funds for pension benefits has become more serious. In line with the extension of the retirement age, the pension premium payment period is expected to be extended while the age at which pension benefits begin to accrue is expected to be raised. This will improve the balance of pension financing (Note 3).
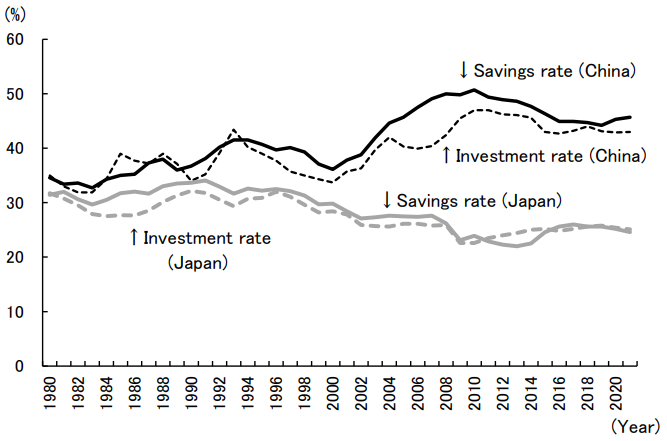
Against the backdrop of an aging population, the savings rate (ratio of savings to GDP) in Japan and China peaked at 34.1% in 1991 and 50.7% in 2010, respectively, before declining to 24.6% and 45.7% in 2021 (Figure 6). Reflecting the fact that most investment is financed by domestic savings, the investment rate (capital formation as a proportion of GDP) in both countries has declined in tandem with the savings rate. The slowdown in investment has meant stagnant capital accumulation, which, along with a declining labor force, has reduced the potential growth rates of both Japan and China. As a countermeasure, productivity should be increased through accelerated innovation and industrial upgrading.
Source: Compiled by the author from China Statistical Abstract 2022, National Bureau of Statistics, China, and National Accounts Statistics, Cabinet Office, Japan.
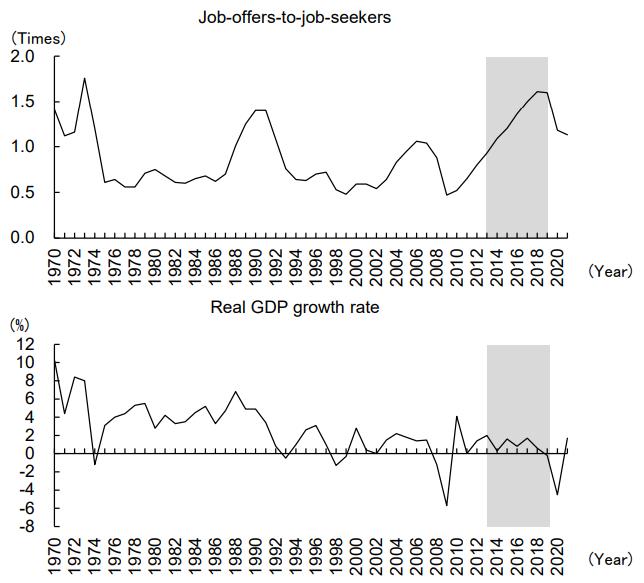
In the case of Japan, however, the economic slump has been prolonged because of the failure of structural reforms. For example, Abenomics, with its "three arrows," the first arrow, "bold monetary policy," and the second arrow, "flexible fiscal policy," have been successful in bringing about full employment, as indicated by the fact that the job-offers-to-job-seekers ratio temporarily exceeded that of the late 1980s bubble economy. On the other hand, the aggressive fiscal policy has resulted in massive government debt, and the long-term low interest rate policy has helped sustain "zombie companies" that should have been eliminated. Furthermore, the third arrow, a "growth strategy to stimulate private investment," ended in failure, and the implementation of Abenomics did not boost the potential growth rate (Figure 7).
Source: Compiled by the author from the Ministry of Health, Labour and Welfare for the job-offers-to-job-seekers ratio, and from the Cabinet Office for real GDP.
Japan's experience suggests that demand stimulus measures centered on expansionary fiscal and monetary policies have only a temporary effect and that supply-side reforms are essential to achieve sustainable growth rates. To avoid making Japan's mistake, China must reform and open up further, capitalize on the vitality of private enterprises, and at the same time, exploit its latecomer's advantage through the introduction of technology from overseas. However, with the government's industrial policy focusing on strengthening state-owned enterprises and indigenous innovation against a background of a return to public ownership domestically and the decoupling of the U.S. and Chinese economies in external relations, the road to growth recovery is expected to be extremely difficult.
BOX Demographics of India
India's total population grew from 697 million in 1980 to 1.396 billion in 2020. According to the UN projections, it will overtake China as the world's largest population in 2023 and reach 1.670 billion by 2050, 357 million more than China.
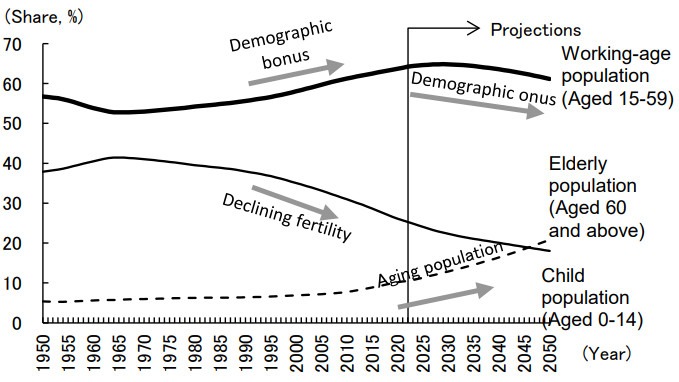
Looking at the age structure of the population, the proportion of the child population aged 0-14 in India declined from 39.5% to 26.1% between 1980 and 2020, while the proportion of the aging population aged 60+ rose from 6.3% to 10.2% and the proportion of the working-age population aged 15-59 rose from 54.2% to 63.7%. The age structure of India's population in 2020 was similar to that of China in the late 1990s. According to the UN projections, the pace of increase in the proportion of the elderly population will eventually overtake that of decline in the proportion of the child population, and the proportion of the working-age population will peak in 2029 and then begin to fall gradually (Figure).
The median age of the population in India was 27.3 years in 2020, up from 19.0 years in 1980, but still 10.1 years below China. According to the UN projections, this will rise to 38.1 years by 2050, but the gap with China will increase to 12.6 years.
The life expectancy of the Indian population increased from 53.6 years in 1980 (10.8 years lower than China) to 70.2 years in 2020 (7.9 years lower than China); by 2050 it will reach 77.9 years, closing the gap with China to 5.9 years, according to the UN projections.
Footnotes:
The original text in Japanese was posted on October 28, 2022.


