AMU and AMU Deviation Indicators
The Purpose of AMU and AMU Deviation Indicators1 for East Asian Currencies
The monetary authorities of East Asian countries have been strengthening their regional monetary cooperation since the Asian currency crisis of 1997. This monetary cooperation after the crisis resulted in the Chiang Mai Initiative (CMI), which was established by the ASEAN + 3 (Japan, South Korea, and China) as a network of bilateral and multilateral swap arrangements to deal with a currency crisis in member countries. Under the CMI, the monetary authorities should conduct surveillance to prevent future currency crises.
As one of the new surveillance criteria, we propose the creation of AMU and AMU Deviation Indicators for East Asian currencies. These should contribute to coordinated exchange rate policies in East Asia, thereby enhancing the monetary authorities' surveillance capabilities. We calculate the AMU as a weighted average of East Asian currencies according to the method used to calculate the European Currency Unit (ECU) adopted by the European Union (EU) countries under the European Monetary System (EMS) prior to the introduction of the euro. The AMU Deviation Indicators for each East Asian currency are measured to show the degree of deviation from the benchmark rate for each of the East Asian currencies in terms of the AMU.
We provide Nominal AMU Deviation Indicators on a daily basis and Real AMU Deviation Indicators, which are adjusted for differences in inflation, on a monthly basis. The Real AMU Deviation Indicators are more appropriate for conducting surveillance on the effects of changes in exchange rates on the real economy, while the Nominal AMU Deviation Indicators are more useful for monitoring their day-to-day deviations from the AMU.
Calculating the Value of the AMU
We choose the ASEAN10+3 currencies as the component currencies of the AMU. The ASEAN10+3 is composed of Brunei, Cambodia, Indonesia, Laos, Malaysia, Myanmar, the Philippines, Singapore, Thailand, Vietnam, Japan, South Korea, and China.
We calculate the AMU according to the method used to calculate the ECU under the EMS prior to the introduction of the euro in 1999. In the same way that the ECU was defined as a basket of currencies of EU member countries, the AMU is defined as a basket currency of the ASEAN10+3 countries. The weight of each currency in the basket is based on both the countries' respective shares of the gross domestic product (GDP) measured at purchasing power parity (PPP) and trade volumes (the sum of exports and imports) in the total of sampled countries for the relevant country. We calculate the countries' shares of GDP measured at PPP and the average trade volumes for the most recent three years as the currency shares of the AMU (the current version is based on 2020-2022). The average for the most recent three years for which data are available is used to calculate the currency shares in order to reflect the most recent trade relationships and economic conditions of the 13 East Asian countries for calculation of the AMU.
We should quote the value of the AMU in terms of a weighted average of the U.S. dollar and the euro because both the United States and the EU countries are important trading partners for East Asia. The weighted average of the U.S. dollar and the euro (hereafter, US$-euro) is based on the East Asian countries' trade volumes with the United States and the euro area, and the share of invoice currency in Asian countries. The weights on the U.S. dollar and the euro are set at 65% and 35%, respectively 2.
Next, we choose a benchmark period in order to calculate the AMU Deviation Indicators. The benchmark period is defined as the following: total trade balance of member countries, total trade balance of the member countries (excluding Japan) with Japan, and total trade balance of member countries with the rest of world should be relatively close to zero.
")
Table 1, which shows the trade accounts of the 13 East Asian countries from 1990 to 2022, indicates that the figures were the closest to balance in 2001. Assuming a one-year time lag before changes in exchange rates affect trade volumes, we should choose 2000 and 2001 as the benchmark period. For the benchmark period, the exchange rate of the AMU in terms of the US$-euro is set at unity. We define the exchange rate of each East Asian currency in terms of the AMU during the benchmark period as the benchmark exchange rate.
In summary, the AMU weights are calculated based on both the arithmetic shares of trade volumes and GDP measured at PPP (average of latest three years). The benchmark exchange rate for each currency is defined in terms of the AMU during 2000-2001. Table 2 shows the AMU weights as well as trade volume, GDP measured at PPP, arithmetic shares, and the benchmark exchange rates.

We can use the AMU weights in Table 2 to calculate an exchange rate for the AMU in terms of the US$-euro as follows3 :
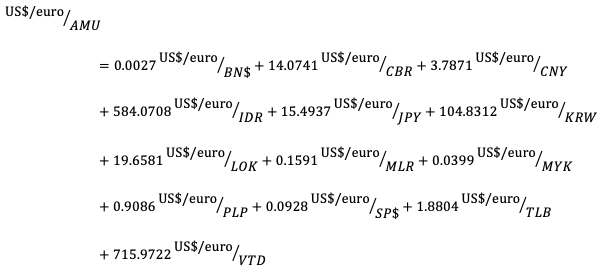
Figure 1 shows the daily movements in the nominal exchange rate of the AMU in terms of the US$-euro. For reference, we add the daily movements in both of the nominal exchange rates of the AMU in terms of the U.S. dollar and the euro.
Calculating Nominal and Real AMU Deviation Indicators
We use the nominal exchange rate of each East Asian currency in terms of the AMU to calculate a Nominal AMU Deviation Indicator for each East Asian currency from the benchmark exchange rate with the viewpoint of deviation from the AMU, which is a weighted average of East Asian currencies determined according to the following formula:
Figures 2 and 3 show movements in the Nominal AMU Deviation Indicators on a daily and monthly basis, respectively.
Next, we calculate an AMU Deviation Indicator in real terms by taking into account inflation rate differentials. Given that the Nominal AMU Deviation Indicator is defined as equation (1), we calculate a Real AMU Deviation Indicator according to the following equation:
We use Consumer Price Index (CPI) data4 as the price index in calculating the Real AMU Deviation Indicator. Since the CPI data are available only on a monthly basis, we calculate the Real AMU Deviation Indicator monthly. As for the inflation rates in the AMU area, we calculate a weighted average of the CPI for the AMU area using the AMU shares, which is the combination of shares in terms of trade volumes and GDP measured at PPP. Figure 4 shows movements in the Real AMU Deviation Indicators on a monthly basis for each of the East Asian currencies.
We should monitor the Real AMU Deviation Indicators rather than the Nominal AMU Deviation Indicators in order to consider the effects of exchange rates on real economic variables such as trade volumes and real GDP. On the other hand, the Nominal AMU Deviation Indicators are more useful than the Real AMU Deviation Indicators when we consider both frequency and time lags as important for monitoring these measures. Accordingly, we should use the Nominal and Real AMU Deviation Indicators as complementary measures for surveillance of exchange rate policy and related macroeconomic variables and, in turn, for devising coordinated exchange rate policies among the East Asian currencies.
We use the CPI data as a price index because there are data constraints for some of the sampled countries where we have no alternative but to use the CPI data as a price index.
Revision of the Benchmark Period and the AMU Weights
The benchmark period is revised annually, after all of the data on trade accounts of ASEAN10+3 countries are updated. Likewise, AMU weights are revised annually, after all of the data on trade volumes and GDP measured at PPP are updated. Current AMU weights are in their 20th version and were revised on January 2025.