
How can a basketball team guard the Golden State Warriors' Kevin Durant? Should they put a shorter man on him to stop him from dribbling? If so, the 7-foot tall Durant may shoot over the defender. Should they use two men to defend him? If so, two other Warriors' shooters, Stephen Curry and Klay Thompson, may be open. Every choice has problems, and the ultimate test is whether the strategy works.
Economic policymaking in Asia is like this. This is clear in the case of trade imbalances between China and the U.S. Because parts and components for China's exports flow from East Asia, China's surpluses are actually Asian surpluses. These surpluses have generated protectionist pressures, tariffs, and a trade war with the U.S. These impediments to trade are difficult for Asia because exporting contributed to miraculous growth in Japan, South Korea, Taiwan, ASEAN, and China.
One strategy is for China to seek a truce by buying more soybeans and wheat. The problem with this approach is, because the imbalances are driven by macroeconomic factors, these purchases will not prevent large U.S. trade deficits and protectionist pressures from returning. Another strategy is for Asia to work with the U.S. to resolve the imbalances. A precedent for this is the 1985 Plaza Accord, when France, Germany, Japan, and the U.K. deflected U.S. protectionist pressures by appreciating their currencies against the dollar. The U.S. in turn agreed to reduce its budget deficit. The Accord was followed a few years later by the last current account surplus the U.S. has run. The problem with appreciations is that they squeeze the profit margins of Asian firms and reduce their exports (see, e.g., Thorbecke 2014 (Note 1)).
Exchange Rates and China's Processed Exports
How would appreciations affect China's surpluses? These surpluses are concentrated in the processing trade regime. Imports for processing are parts and components that enter China duty free and that can only be used to produce goods for re-export. Processed exports are the final goods produced using imports for processing. China's global surpluses in processing trade exceeded $300 billion in every year from 2010 and 2018. Its surpluses on ordinary trade, on the other hand, rise and fall with the value of imported primary products and averaged $85 billion per year over this period.
Cheung, Chinn, and Qian (Note 2) (2012), using the CPI-deflated real effective exchange rate and dynamic ordinary least squares (DOLS) estimation over the 1994Q3-2010Q4, reported that a 10 percent RMB appreciation would reduce processed exports by between 9 and 12 percent. Patel and Wei (2019) (Note 3) noted that processed exports should also depend on exchange rates in supply chain countries. If Japan produces parts that go into phones that China exports, a weaker yen should increase the price competitiveness of China's phones.
In ongoing work we have investigated how exchange rates in upstream countries affect China's exports (see Thorbecke and Smith, 2010). We calculated a supply chain exchange rate (ssrer) as the geometrically weighted average of exchange rates in the nine countries providing the most imports for processing to China. (Note 4) ssrer can be included in a DOLS regression together with the CPI-deflated renminbi real effective exchange rate (rmb) and GDP in OECD countries (yOECD) to explain processed exports (ex). The results are:
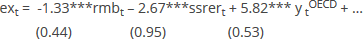
DOLS (1,1) estimates. Sample period = 1993Q3-2017Q4. Adjusted R-squared = 0.968, Standard error of regression = 0.158, HAC standard errors in parentheses. *** denotes significance at the 1% level.
The results indicate that a 1 percent appreciation of the renminbi would reduce the volume of processed exports by 1.3 percent, a 1 percent appreciation in supply chain countries would reduce export volumes by 2.7 percent, and a 1 percent fall in rest of the world GDP would reduce volumes by between 5.8 and 7.1 percent. We can also use the model to perform out-of-sample forecasts over the 2018Q1 to 2018Q4 period using actual values of the independent variables. The root-mean-squared error measure of the model's forecast error (RMSE) equals 0.386. If we exclude ssrer, the RMSE increases to 0.608. This implies that exchange rates in supply chain countries still help to forecast processed exports in 2018.
How have the renminbi and exchange rates in supply chain countries evolved? Figure 1 shows that the renminbi has appreciated 10 percent between the first quarter of 2012 and the last quarter of 2018. It also shows that ssrer has the same value at the end of 2018 as it did in the first quarter of 2012. Over this period 55 percent of ssrer‘s value has been driven by Taiwanese and Korean exchange rates and 80 percent by Taiwanese, Korean, Japanese and Singaporean exchange rates. Taiwan's current account surplus from 2010 to 2018 averaged 12 percent of GDP; Korea's averaged 5.7 percent; Japan's averaged 2.5 percent; and Singapore's averaged 17 percent. In spite of these enormous surpluses, their currencies have barely appreciated.

Source: CEIC Database and calculations by the author.
Exchange Rates and China's Electronics Exports
China's surplus in electronics goods has averaged $330 billion per year since 2011. This equals more than half of China's overall surplus. Electronics goods include consumer electronics, telecommunications equipment, computer equipment, electronic components, precision instruments, clock making, and optics. China's electronics exports are produced using electronic parts and components (ep&c) from upstream countries. Exports can again be modeled as a function of the Chinese real exchange rate, exchange rates in upstream countries, and GDP in importing countries. China's exports to major importing countries are examined. These are: Australia, Canada, the Czech Republic, France, Germany, Japan, Malaysia, Mexico, the Netherlands, the Philippines, Poland, Singapore, South Korea, Taiwan, Thailand, the United Kingdom, and the United States.
To investigate how exchange rates in upstream countries affect the price competitiveness of China's electronics exports, a weighted average of exchange rates in countries providing ep&c is constructed. Since 2000, more than 90 percent of China's imports of electronic parts and components has come from Taiwan, South Korea, Malaysia, Japan, Singapore, the Philippines, the U.S., Thailand, and Germany. Exchange rates in these countries are used to construct a weighted exchange rate in supply chain economies (Note 5).
Weighted exchange rates between the leading suppliers of ep&c to China and the countries purchasing electronics goods from China are calculated using the formula:

where wrerj,t is the weighted exchange rate between the nine countries providing ep&c to China and country j importing electronic goods from China, wi,t is the value of ep&c exported from upstream country i to China divided by the value of ep&c exported from all nine upstream countries to China, and reri,j,t is the bilateral real exchange rate between upstream country i and country j importing electronic goods from China. An increase in wrerj,t represents an appreciation in upstream exchange rates relative to the country importing China's electronic goods. The volume of China's electronics exports to country j can be regressed on wrerj,t , the bilateral real exchange rate between China and country j (rmbj,t ), and real GDP in importing country j ( yj,t *). Panel DOLS estimation yields:
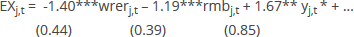
Adjusted R-squared = 0.956, Standard error of regression = 0.212, Sample period = 2001-17 cross sections included. Standard errors in parentheses. *** denotes significance at the 1% level.
All of the coefficients are correctly signed and statistically significant. They indicate that a 1 percent appreciation in countries providing ep&c to China would reduce China's electronics exports by 1.4 percent and that a 1 percent appreciation of the renminbi would reduce exports by 1.19 percent. A 1 percent increase in GDP in the importing countries would increase China's exports by 1.67 percent. These results and the results for processed exports both indicate that appreciations in supply chain countries cause larger decreases in China's exports than appreciations of the renminbi.
Figure 2 presents weighted exchange rates for wrerj,t and rmbj,t . The figure shows that the by this measure also the renminbi has appreciated significantly but that exchange rates in supply chain countries have not. This supports the findings in Figure 1 with very different exchange rate measures indicating that, despite large current account surpluses, exchange rates in Korea, Taiwan, Japan, and Southeast Asian countries have not appreciated.

Source: CEPII-CHELEM database and calculations by the author.
Discussion
There is a debate about whether the renminbi exchange rate should be included in China-U.S. trade negotiations (Note 6). The results presented here suggest it would be more productive to include the Korean won, the New Taiwan dollar, and the Japanese yen in the China-U.S. talks than to include the renminbi.
It would be difficult for Korea, Taiwan, Japan, and other Asian economies if their currencies appreciated. However, appreciations would disrupt trade much less than equivalent tariffs. Benassy-Queré, Bussière, and Wibaux (Note 7) (2018) investigated bilateral trade flows between 110 countries at the Harmonized System (HS) six-digit level. They found that a 10 percent tariff reduces exports by 1.3 percent and that a 10 percent exchange rate appreciation reduces exports by 0.5 percent. Tariffs thus reduce exports three times more than appreciations do. This effect is called the international elasticity puzzle, and has also been reported by Fontagné, Martin, and Orefice (2018), Fitzgerald and Haller (2014), and Ruhl (2008).
The disruption caused by tariffs is multiplied by the uncertainty that accompanies trade wars and protectionism. Bloom (2009) showed that heightened uncertainty deters investment. Capital formation is crucial for East Asia's flagship industry, electronics, and for many other industries. By reducing investment, uncertainty jeopardizes the ability of Asian firms to stay close to the technological frontier.
Appreciations would not only be less disruptive than tariffs and trade wars but would also benefit countries in the region by increasing the purchasing power of consumers and allowing them to import more. Cheung, Chinn, and Qian (Note 8) (2015), using an autoregressive distributed lag model over the 2001Q1 – 2012Q4 period, reported that 90 percent of China's imports from the U.S. are from the "ordinary trade" customs regime and that a 10 percent renminbi appreciation would increase ordinary imports by 17 percent. Thorbecke (Note 9) (2011), using panel DOLS estimation and data from 1979 to 2007, reported that exchange rate appreciations would increase consumption imports into several East Asian countries. Updating the estimates up to 2017 confirms that appreciations in East Asia still increase imports. These results imply that stronger exchange rates may allow Asian consumers to supplant American consumers as a source of demand for the region's exports.
To strengthen the potential for East Asia to be an engine of growth, economies in the region should establish ironclad free trade agreements among themselves. When South Korea and Japan faced off over wartime labor, the Japanese Finance Minister threatened tariffs on Korean products (Japan Times (Note 10), 2019). When South Korea deployed the US-built Thaad missile shield, Beijing banned Chinese tour groups from visiting South Korea (Harris et al. (Note 11), 2017). Asian countries should eschew protectionism and employ other policy instruments to address difficult issues.
To appreciate together Asian countries need to decrease the weight of the U.S. dollar in their implicit currency baskets. Ogawa and Ito (2002) noted that if an important trading partner of Asian country A puts heavy weight on the U.S. dollar, it may cause country A to do so also. This can produce a Nash equilibrium. On the other hand, if A's trading partner put more weight on regional currencies, then it may be optimal for A to put more weight on regional currencies. This would also be a Nash equilibrium. Putting more weight on regional currencies however would facilitate a concerted appreciation against the dollar.
No Asian country wants to let its exchange rate appreciate against the U.S. dollar for fear of losing price competitiveness relative to its Asian neighbors. However, perennial surpluses put pressure on their currencies to appreciate. Policymakers should consider acceding to these market forces and allowing their currencies to appreciate together. In addition, if Japan put less emphasis on its 2 percent inflation target the yen could appreciate. If South Korea and Taiwan reduced outflows from insurance companies and government pension funds, the won and New Taiwan dollar could appreciate. If China extended fewer high interest rate loans to poorer countries, the renminbi could appreciate. None of these countries should act unilaterally though. Rather, given the intricate value chains linking Japan, Korea, Taiwan, China, and ASEAN, policymakers should view exchange rates as a regional issue and confer deeply about exchange rate policy. They could propose a deal with the U.S. resembling the Plaza Accord whereby their currencies appreciate against the dollar in response to assurances of free trade and reductions in U.S. budget deficits.
East Asia's miraculous growth occurred as Asian countries succeeded at exporting in industries such as electronics with tight profit margins. Investments in human and physical capital and the discipline of competing in world markets contributed to learning by doing and productivity growth. Exchange rate appreciations could act as a stick and open markets abroad as a carrot to goad Asian firms to continue assimilating technologies and innovating.
This article first appeared on Econbrowser on May 16, 2019. Reproduced with permission.