
Chinese leaders are determined to rebalance their economy away from an overdependence on exports. How are they progressing?
China's Exports and Imports, 1993-2015
Figure 1 plots China's processing imports and exports and Figure 2 its ordinary imports and exports. These are China's principle customs regimes. Processing imports can only be used to produce goods for re-export (processed exports). This regime reflects the operation of global value chains in East Asia. Ordinary imports are destined primarily for the domestic market and ordinary exports are produced primarily using domestic inputs.
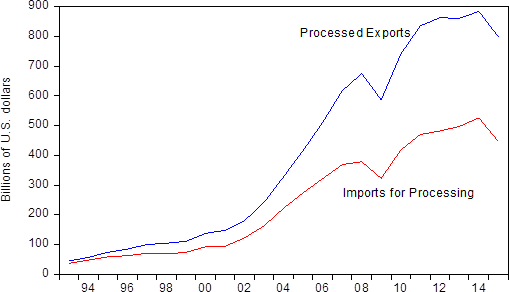
Figure 1 indicates that the gap between processed exports and imports for processing keeps growing. This implies that more and more of the value-added of processed exports such as smartphones, tablet computers, and consumer electronics goods comes from China. The gap is even wider than the figure indicates, since each year more than USD 70 billion of "imports" for processing are produced in China and round-tripped out of China and back in to take account of favorable tax provisions (see Xing, 2012).
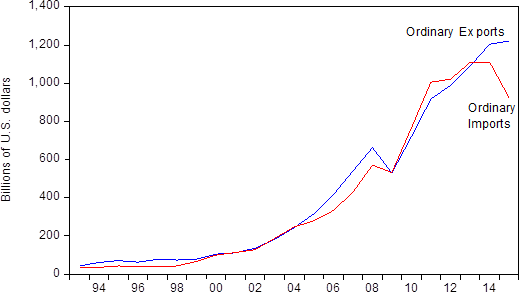
Figure 2 indicates that ordinary exports have grown very rapidly, and only started to decelerate in 2015. The figure also shows that ordinary imports have fallen in 2015. The fall in imports reflects the drop in the prices of primary products such as crude oil, as well as a decrease in import demand arising from China's slowdown and from President Xi Jinping's crackdown on government officials receiving luxury imported goods (Qian and Wen, 2015).
If we correct processing and ordinary trade for round-tripping imports, China ran a surplus in 2015 of $422 billion in processing trade and $330 billion in ordinary trade. China's combined surplus in processing and ordinary trade thus equaled $752 billion or 6.7 percent of Chinese GDP in 2015. This implies that China ran a huge surplus in the manufactured products that make up the lion's share of processing and ordinary trade. While its surplus in ordinary trade appeared in 2014, its surplus in processing trade has remained a little less than half a trillion dollars for the last five years.
Its total goods surplus, including other trade regimes such as customs warehousing trade, was over 5 percent of GDP in 2015 and its current account surplus just under 3 percent. According to Chinese balance of payments statistics, its current account surplus was below its merchandise trade surplus largely because of a deficit in tourism trade. Politically, the large surpluses in manufacturing goods are likely to lead to dislocation, extremist policies and protectionism in trading partners (Schwartz and Bui, 2016).
Determinants of China's Exports
What drives China's trade? Using dynamic ordinary least squares (DOLS) estimation and quarterly data over the 1994-2010 sample period, Cheung, Chinn, and Qian (2012) reported that a 10 percent RMB appreciation would reduce processed exports by between 9 and 12 percent and ordinary exports by between 13 and 19 percent. They also reported that income elasticities exceed unity for processed exports but are ambiguous for ordinary exports.
Equations (1) and (2) report DOLS results for China's exports with the sample extending to the end of 2015. In addition to the CPI-deflated renminbi real effective exchange rate and real GDP in importing countries, the equations include weighted exchange rates in supply chain countries. Weighted exchange rates are included because processed exports such as smartphones contain parts and components such as processors produced in South Korea, Taiwan, Japan, and other supply chain countries (see Thorbecke, 2015, for details on calculating the weighted exchange rate).
The results for processed and ordinary exports, with standard errors in parentheses, are:
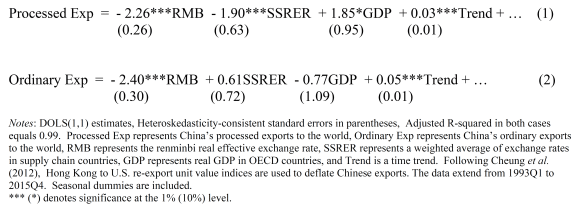
The results indicate that, for processed exports, a 10 percent appreciation of the renminbi would reduce exports by 23 percent and a 10 percent appreciation in East Asian supply chain countries would reduce exports by 19 percent. A 10 percent increase in real GDP in the rest of the world would increase processed exports by 19 percent. The results also indicate that, for ordinary exports, only the renminbi exchange rate matters. The finding that exchange rates in supply chains do not matter in equation (2) may be because more of the value-added of ordinary exports comes from China rather than from imported parts and components. In any case, since China's supply chains keep becoming deeper, the Chinese exchange rate should matter more and more for both ordinary and processed exports going forward.
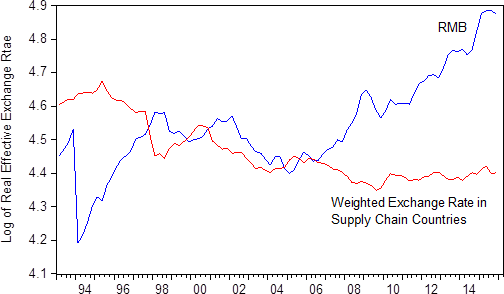
Figure 3 plots the CPI-deflated real effective exchange rate for the renminbi and for supply chain countries. It shows that China's exchange rate has appreciated 47 percent between 2005Q2, when China abandoned its fixed peg to the U.S. dollar, and the end of 2015. By contrast, there has been a 4 percent depreciation in supply chain countries since the second quarter of 2005. With large capital outflows from China heading for housing, agriculture, companies, and other foreign investments and with South Korea and Taiwan reeling from competition with China, there is little prospect for an appreciation of either the renminbi or of exchange rates in supply chain countries.
How to Increase the Return on China's Investments
The capital outflows represent a misallocation of resources, as the returns would be much higher from investing in the people of China. For instance, a study at Peking University found that air pollution in China reduces people's life expectancy by 5.5 years (Chen, Ebenstein, Greenstone, and Li , 2013). Another study found that that polluting industries contaminated between 8 and 20 percent of China's arable land and produced hundreds of "cancer villages" where residents die young because of exposure to toxins (see Chin and Spegele, 2013).
As another example, Fang et al. (2012) reported that the return to an additional year of education in the PRC equaled 20 percent per year. While schools are good for residents of Beijing and Shanghai, they are substandard for rural children. Rozelle (2010) noted that most rural children cannot afford pre-school, and that elementary school attendance is hampered by poor accessibility and long, dangerous commutes. Bad health, sanitation, nutrition, and psychology management also restrict students' ability to learn. Problems such as anemia, vitamin deficiencies, visual difficulties are prevalent and can be remedied inexpensively. For instance, one multivitamin with iron will address both anemia and vitamin deficiencies and costs about 3 U.S. cents per student per day (Rozelle, 2010).
Smith, Rozelle, and Medina (2014) found that 34 percent of 3-5 year olds and 40 percent of 8-10 year olds in Guizhou Province were infected with intestinal worms, and that being infected significantly worsened academic performance, working memory, processing speed, height for age, and body mass index for age. In addition, deworming medicines are cheap and safe. The State Council initially allocated 60 million renminbi for deworming in Guizhou, but then did not follow through because it was "not a priority (Smith, Rozelle, and Medina, 2014). Rural students will be the urban workers of tomorrow, and investing in them now will pay high dividends later.
China's leaders desire to move away from overdependence on exports. Currently exports and imports remain imbalanced. Large capital outflows from China will cause foreign trade to continue playing a disproportionate role. If investments could be rechanneled into the health, education, and welfare of its people, not only would China's long run growth trajectory rise but the process would be more harmonious and peaceful.
This article first appeared on Econbrowser on May 5, 2016. Reproduced with permission.