Continuing rise in the Marshallian k
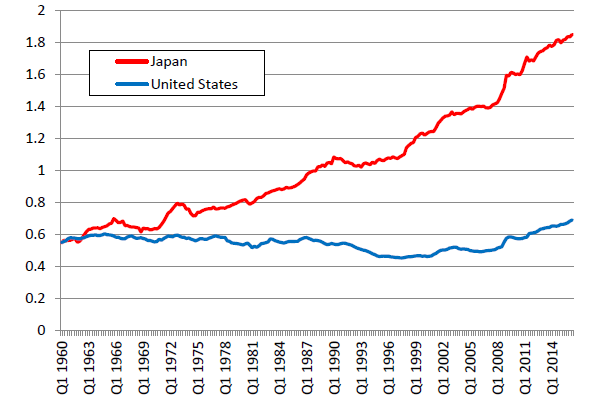
Japan's Marshallian k, the ratio of the money supply to nominal gross domestic product (GDP), is at its highest level since 1960. A comparison with the United States, where the Marshallian k has been relatively stable, shows that there has been a significant deviation (Figure 1).

As shown in Figure 1, the upward trend of Japan's Marshallian k has been continuing throughout the years, not just after the Bank of Japan embarked on its quantitative easing policy. There have been several periods in which a particularly sharp increase was observed. The first one is from 1971 through 1974, namely, starting with excessive liquidity under then Prime Minister Kakuei Tanaka's "Plan for Remodeling the Japanese Archipelago" and ending with the oil crisis. The second one began in 1985 with a rise in excess liquidity across the world and continued throughout Japan's real estate bubble period to around 1990. Meanwhile, the third one coincided with the period of economic recession from 1997 through 2002, this time caused by the weakness of nominal GDP rather than an increase in liquidity. Then came the fourth one from late 2008, following the collapse of Lehman Brothers, through 2011, again coinciding with a period of declining nominal GDP.
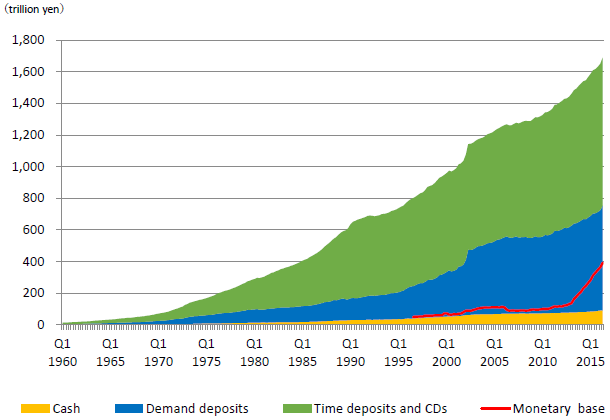
The factors behind these four episodes are not identical. In the first two cases, excess liquidity is the primary cause, whereas the latter two are more attributable to the stagnant economy and the risk-averse behavior of companies and households to shy away from investments and keep more cash on hand. In particular, changes in motives for retaining cash over the past few years can be observed in changes in the composition of the money supply (Figure 2).

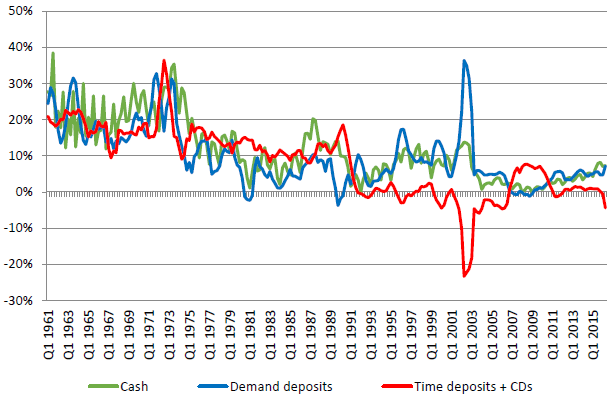
Figure 3 shows changes in the percentage year-on-year growth in each of the following money supply categories: cash, demand deposits, and time deposits including certificates of deposit (CDs). We can see that the growth rate for demand deposits and that for time deposits moved divergently depending on the phase of the economy. Up until the 1974 oil crisis, the growth rates for all of the three categories generally moved in tandem. After that, however, they generally followed the pattern in which growth in cash and time deposits outpaces that in demand deposits when the economy is on an upward trajectory, whereas growth in cash and demand deposits outpaces that in time deposits when the economy is down.

This change in the pattern can be partly explained by changes in the risk-taking attitude of companies and households. More specifically, when the Japanese economy entered the stable growth period, they grew conscious of risks that had hardly bothered them in the preceding high growth period. This resulted in both companies and households prioritizing maintaining liquidity over investing for returns when so dictated by the state of the economy.
Such risk-averse tendency of companies and households seems to have grown stronger after the burst of the real estate bubble. Indeed, Figure 3 shows that the growth rate for demand deposits has been exceeding that for time deposits throughout the period since 1990 except for the few years just before and after Lehman's collapse, suggesting that their risk-averse attitude has taken root.
Japan's growth strategy and monetary policy need a shift in focus
It appears that Japanese companies and households have been in risk-averse mode throughout the past 20 or so years while the Marshallian k has continued to rise against the backdrop of weak economic growth. This situation is abnormal, as evident in comparison with the United States, where the Marshallian k has been relatively stable, or with other countries with more dynamic economies than Japan.
In particular, changing the risk-averse attitude of companies and households, as seen in a significant rise in demand deposits, is a tough challenge. It means that Japan needs to create an economic and financial environment that allows companies and households to take risks more aggressively. Fiscal and monetary policies designed to boost economic recoveries both at home and abroad will remain just as much needed as they have been as short-term measures. However, it will be difficult to change the long-ingrained risk-averse attitude with those policies alone.
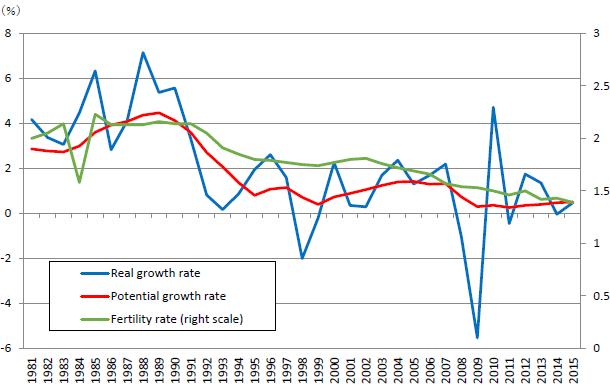
What is needed are measures designed to boost Japan's growth potential over the long term and growth strategies centering on structural reform of the economy. The essential elements of this endeavor are extensive measures to encourage fertility and slow population aging as well as phenomenal innovation or Industry 4.0 exemplified by the Internet of Things (IoT), Internet, big data, and artificial intelligence (AI). Japan's potential growth rate—which shows significant correlation with the fertility rate from 18 years ago (Figure 4)—would increase by nearly two percentage points if the fertility rate is raised to 1.8 as envisaged in the government's strategy. Although this is just a simple estimate, if such a level of growth is achieved by pro-birth policies and innovation, the persistent risk-averse attitude would disappear.

Meanwhile, given the fact that the significant increase in Japan's Marshallian k reflects an excessive shrinkage of economic activity and excessive money supply, measures capable of boosting nominal GDP and curbing the money supply should be the way to go. In other words, Japan is now being faced with the question of how to increase the use and velocity of money.
Seen in this light, the ongoing quantitative easing policy is double-edged, i.e., while it helps increase nominal GDP by lowering interest rates and increasing prices, it is prone to excessive money supply. Thus, provided that there exists a viable alternative scheme that is capable of delivering the same effects, i.e., lower interest rates and raise inflation, the gradual winding down of the quantitative easing policy would help prevent excessive monetary surplus. This points to the significance of gradually shifting the weight of monetary policy toward a negative interest rate policy (NIRP), which is to push interest rates lower and prices higher by impacting the market in qualitative—rather than quantitative—terms.
Japan's Marshallian k has followed a trajectory that is quite different from that of the United States, and this provides us with many suggestions. It reminds us of the importance of structural reform as a means to revive the Japanese economy and offers some implications for monetary policy. The ways to revitalize the Japanese economy can be explored from various perspectives, and looking at the money supply aspect is one meaningful way.
The original text in Japanese was posted on September 20, 2016.


