
In the fourth quarter of 2011, China's economic growth rate decreased to 8.9%, the lowest since the second quarter of 2009. Meanwhile, the inflation rate remains fairly high at 4.6%, though down from its peak of 6.3% in the third quarter of 2011. Against this backdrop, there is emerging concern that the Chinese economy may run out steam before the monetary authority has a chance to ease it. However, inflation is a lagging indicator of economic growth. Thus, following the slowdown of economic growth in recent months, the inflation rate is expected to move downward to create more room for monetary easing going forward. In what follows, I would like to illustrate the pattern of the business cycle in China after the collapse of Lehman Brothers, focusing on changes in the growth rate of the gross domestic product (GDP) and the inflation rate, and forecast the future course of the Chinese economy.
Inflation as a lagging indicator of growth
As a general rule, inflation is a lagging indicator of economic growth, and this also applies to China. When the economic growth rate goes up, the inflation rate will rise with a certain lag, and likewise, when the economic growth rate moves down, the inflation rate will fall with a lag. When we analyze data for the years since 1998, we can see this time lag between economic growth and inflation is on average three quarters in China. Indeed, when we plot the GDP growth rate from three quarters prior along the x-axis and the inflation rate for the current quarter along the y-axis, we can see a very strong correlation between the two indicators, and the value of elasticity is estimated to be 0.92 (Figure 1). This means that if the GDP growth rate increased/decreased by one percentage point three quarters ago, the inflation rate would increase/decrease by 0.92 percentage points in the current quarter. China's GDP growth rate in the fourth quarter of 2011, which stood at 8.9%, was already significantly below the latest peak of 12.1% in the first quarter of 2010. Following this, the inflation rate peaked in the third quarter of 2011 and has begun to decline.
Figure 1: Correlation between GDP growth and inflation |
 |
(Note) Estimation results. Estimation period: 1Q/1998 through 4Q/2011 |
| (Source) Compiled by the author based on data from a CEIC Database. |
Different stages of the business cycle
Depending on whether the inflation rate is a coincident indicator or a lagging indicator of the economic growth rate, we can derive different patterns of the business cycle.
Suppose the inflation rate is a coincident indicator of the economic growth rate. In this case, if we divide the business cycle into stages depending on whether the economic growth and inflation rates are higher or lower than their respective benchmark values (average), there are only two stages, namely, a period of high growth and high inflation (boom period) and a period of low growth and low inflation (bust period) (Figure 2-a). In a boom period, the central bank tightens monetary policy and, as a result, both the economic growth and inflation rates will decrease. Conversely, in a bust period, the central bank eases monetary policy, leading to an increase in the economic growth and inflation rates. With the economy going from a boom to a bust and then returning to a boom again, the business cycle keeps repeating itself.
Figure 2: Different stages of the business cycle defined by the relationship between the economic growth and inflation rates |
 |
| (Source) Compiled by the author |
In contrast, if the inflation rate is a lagging indicator of the economic growth rate, the business cycle can be divided into the four stages of 1) low growth and low inflation, 2) high growth and low inflation, 3) high growth and high inflation, and 4) low growth and high inflation, which respectively correspond to the recession, recovery, overheating, and stagflation phases of the business cycle (Figure 2-b). In a recession phase characterized by low growth and low inflation, the central bank eases monetary policy, which leads to an increase in the economic growth rate thereby guiding the economy into a recovery phase characterized by high growth and low inflation. Then, following the heels of the economic growth rate, the inflation rate moves up, and the economy enters into an overheating phase which is marked with high growth and high inflation. When the business cycle reaches this phase, the government shifts its policy stance to a tightening mode, which in turn triggers a drop in the economic growth rate thereby leading the economy into stagflation, a phase of low economic growth and high inflation. As the economy slows down, inflation cools down, ushering in a phase of low economic growth and low inflation, hence, a return to recession. As such, the business cycle goes through the phases of recession, recovery, overheating, and stagflation, and returning to a recession. This business cycle can be described as a counter clockwise circle on a coordinate plane in which the x-axis represents the economic growth rate and the y-axis represents the inflation rate, reflecting the latter following the movement of the former (Figure 3). Easy monetary policies implemented in times of recession and monetary tightening in times of overheating help sustain the rotation of this circle.
Figure 3: Business cycle as explained by the interaction between economic growth and inflation |
 |
| (Source) Compiled by the author |
Application to post-Lehman Chinese economy
In applying this analytical framework to post-Lehman China, we must first define the benchmarks against which to determine whether the economic growth and inflation rates at each point of time are high or low. Here, the average economic growth rate (9.4%) and average inflation rate (2.7%) for the period from the fourth quarter of 2008 through the fourth quarter of 2011 are taken as benchmark values (Figures 4 and 5).
Figure 4: Different stages of the business cycle in post-Lehman China |
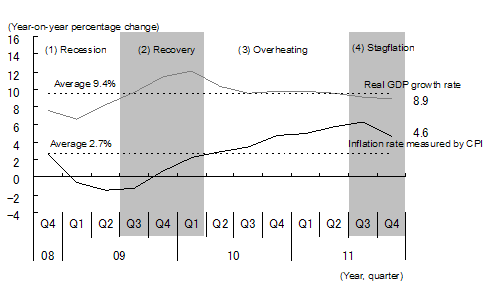 |
| (Note) Stage (1) is characterized by low economic growth and low inflation, (2) by high economic growth and low inflation, (3) by high economic growth and high inflation, and (4) by low economic growth and high inflation. |
| (Source) Compiled by the author based on data from a CEIC Database. |
Figure 5: Cyclical changes in the GDP growth and inflation rates in post-Lehman China |
 |
| (Note) Stage (1) is characterized by low economic growth and low inflation, (2) by high economic growth and low inflation, (3) by high economic growth and high inflation, and (4) by low economic growth and high inflation. The business cycle rotates counter clockwise, i.e., (1)→(2)→(3)→(4). |
| (Source) Compiled by the author based on data from a CEIC Database. |
Based on this, we can infer that the Chinese economy entered into recession, a period of low economic growth and low inflation, in the fourth quarter of 2008 following the impact of the Lehman bankruptcy. In response to this, China quickly shifted its monetary policy stance from tightening to easing and implemented a massive fiscal stimulus package worth more than four trillion yuan. These measures produced intended results, with China's GDP growth rate bottoming out at 6.6% in the first quarter of 2009 and then turning upward. In the third quarter of 2009, the GDP growth rate exceeded the benchmark level of 9.4%, but inflation remained below the 2.7% benchmark, indicating that the economy had entered a recovery phase with high economic growth and low inflation. Then, in the second quarter of 2010, the inflation rate exceeded the benchmark following the earlier rise in the GDP growth rate, thus the economy moved into an overheating stage characterized by high economic growth and high inflation. In this stage, the central bank shifted its monetary policy stance from easing to tightening. As a result, the GDP growth rate turned downward. In the third quarter of 2011, the GDP growth rate finally dipped below the benchmark, and the economy entered into stagflation with low economic growth and high inflation. In the fourth quarter of 2011, the GDP growth rate declined further, but the inflation rate, though having turned downward, remained above the benchmark, and the stagflation phase continued.
The analytical framework just described can be used not only to explain the performance of the Chinese economy in the past but also to predict its future course. Judging from the pattern to date shown in Figure 5, the circle showing the locus of China's economic growth and inflation is likely to continue to rotate in a counter clockwise direction. That is, with a further decline in the inflation rate, the Chinese economy will shift from stagflation to recession at some point in the first half of 2012. The Chinese authorities will then embark on a full-blown monetary easing. With this serving as a pump primer, the economic growth will take an upturn, and the economy will move into a recovery stage toward autumn when the National Congress of the Communist Party of China, a key political event held every five years, meets.
The original text in Japanese was posted on January 31, 2012